Hi,
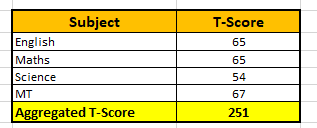
I need help to nicely visualize my output (as enclosed) on mobile app. May be in a fancy table or some other visualization way, chart/graph summary etc.
Please advise.
Thanks

Hi,
I need help to nicely visualize my output (as enclosed) on mobile app. May be in a fancy table or some other visualization way, chart/graph summary etc.
Please advise.
Thanks

Going through search, I can see we can use google table charts or may be python libraries.
Can some please assist with integrated code with AppInventor?