Hello, I am trying to display the electromyography signals on using canvas. I happen to see some similar project. I have been trying to modify it to suit my requirements. I want the signals to be displayed of the Canvas on an X and Y axis. I also want the Y coordinates to display in intervals of (0,10, 20,30,40,50). Finally i want the signals to be able to start the origin of zero. (0). Plea
se can i get any help.?
Hi Anthony - you do know your device has a built-in screenshot ability?
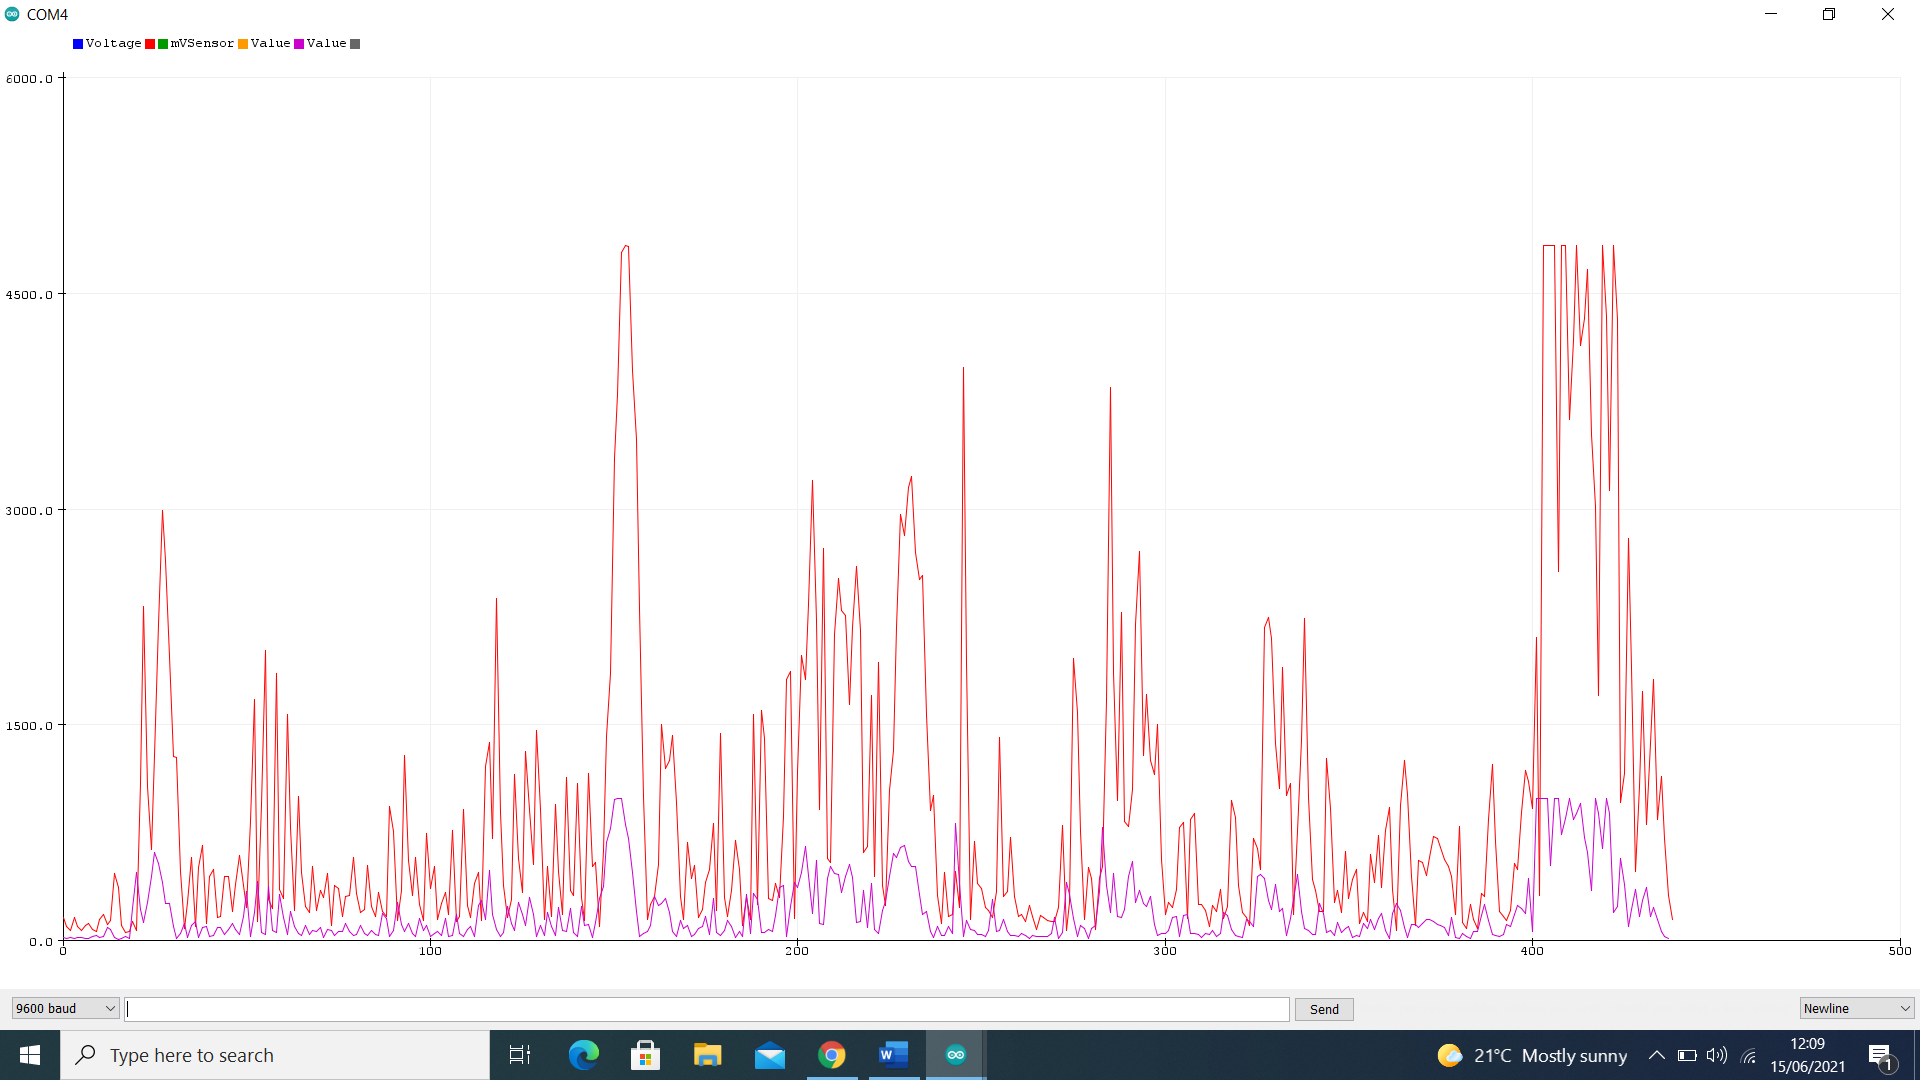
Observations - surely your chart should use the same data that is stored in the Cloud?
There is a good Chart extension which might handle the data better (and be easier to code). You may recognise the Developer.......
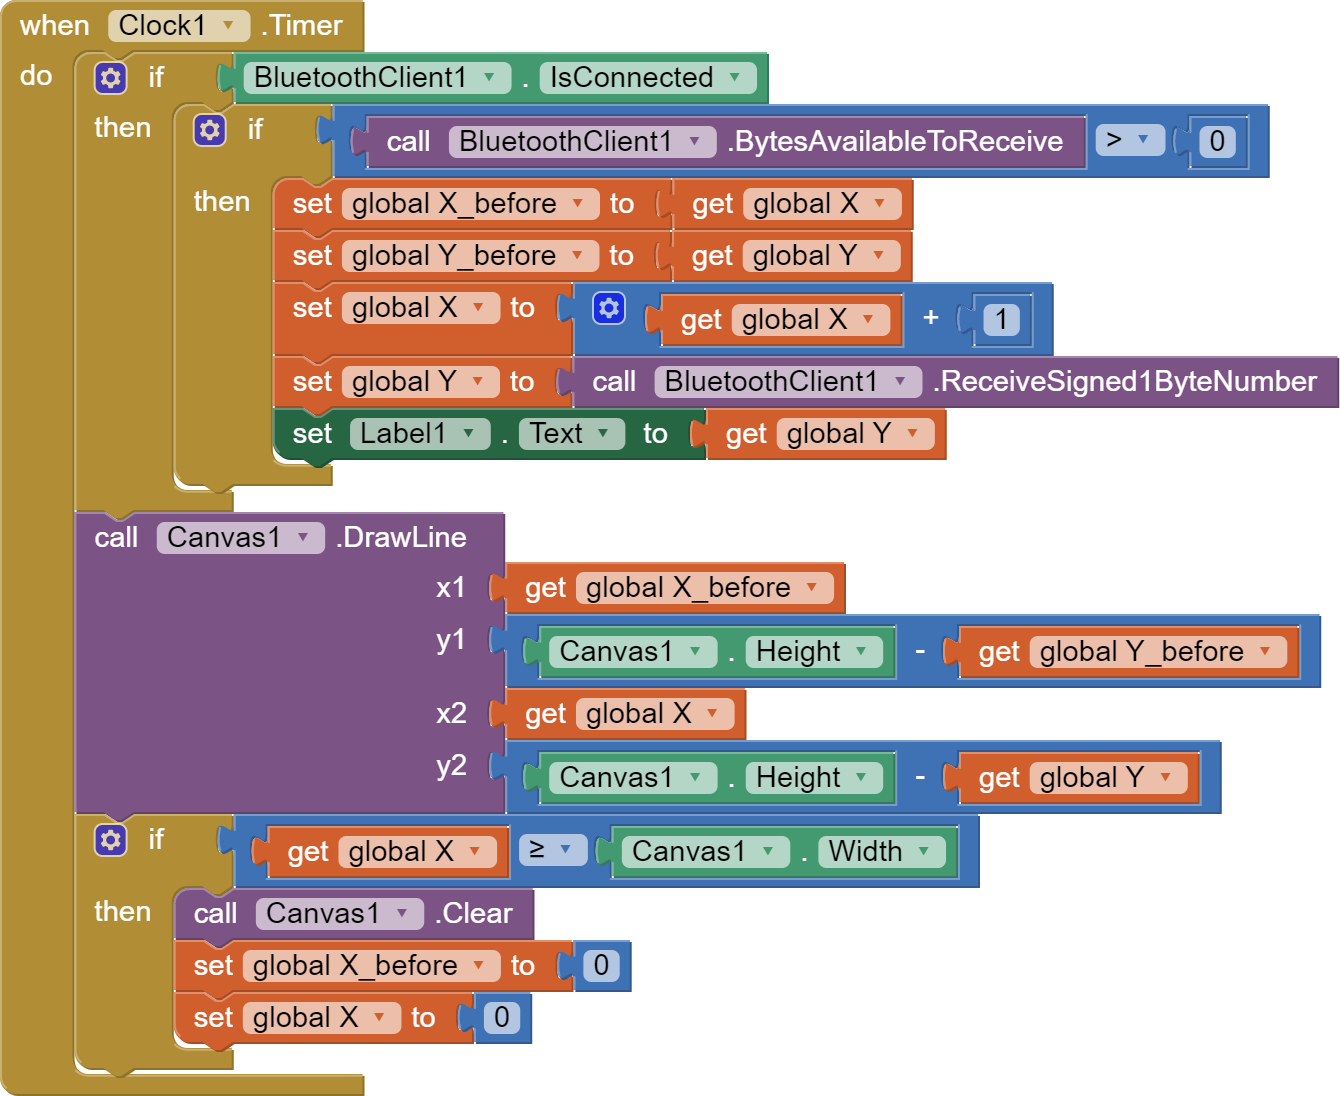
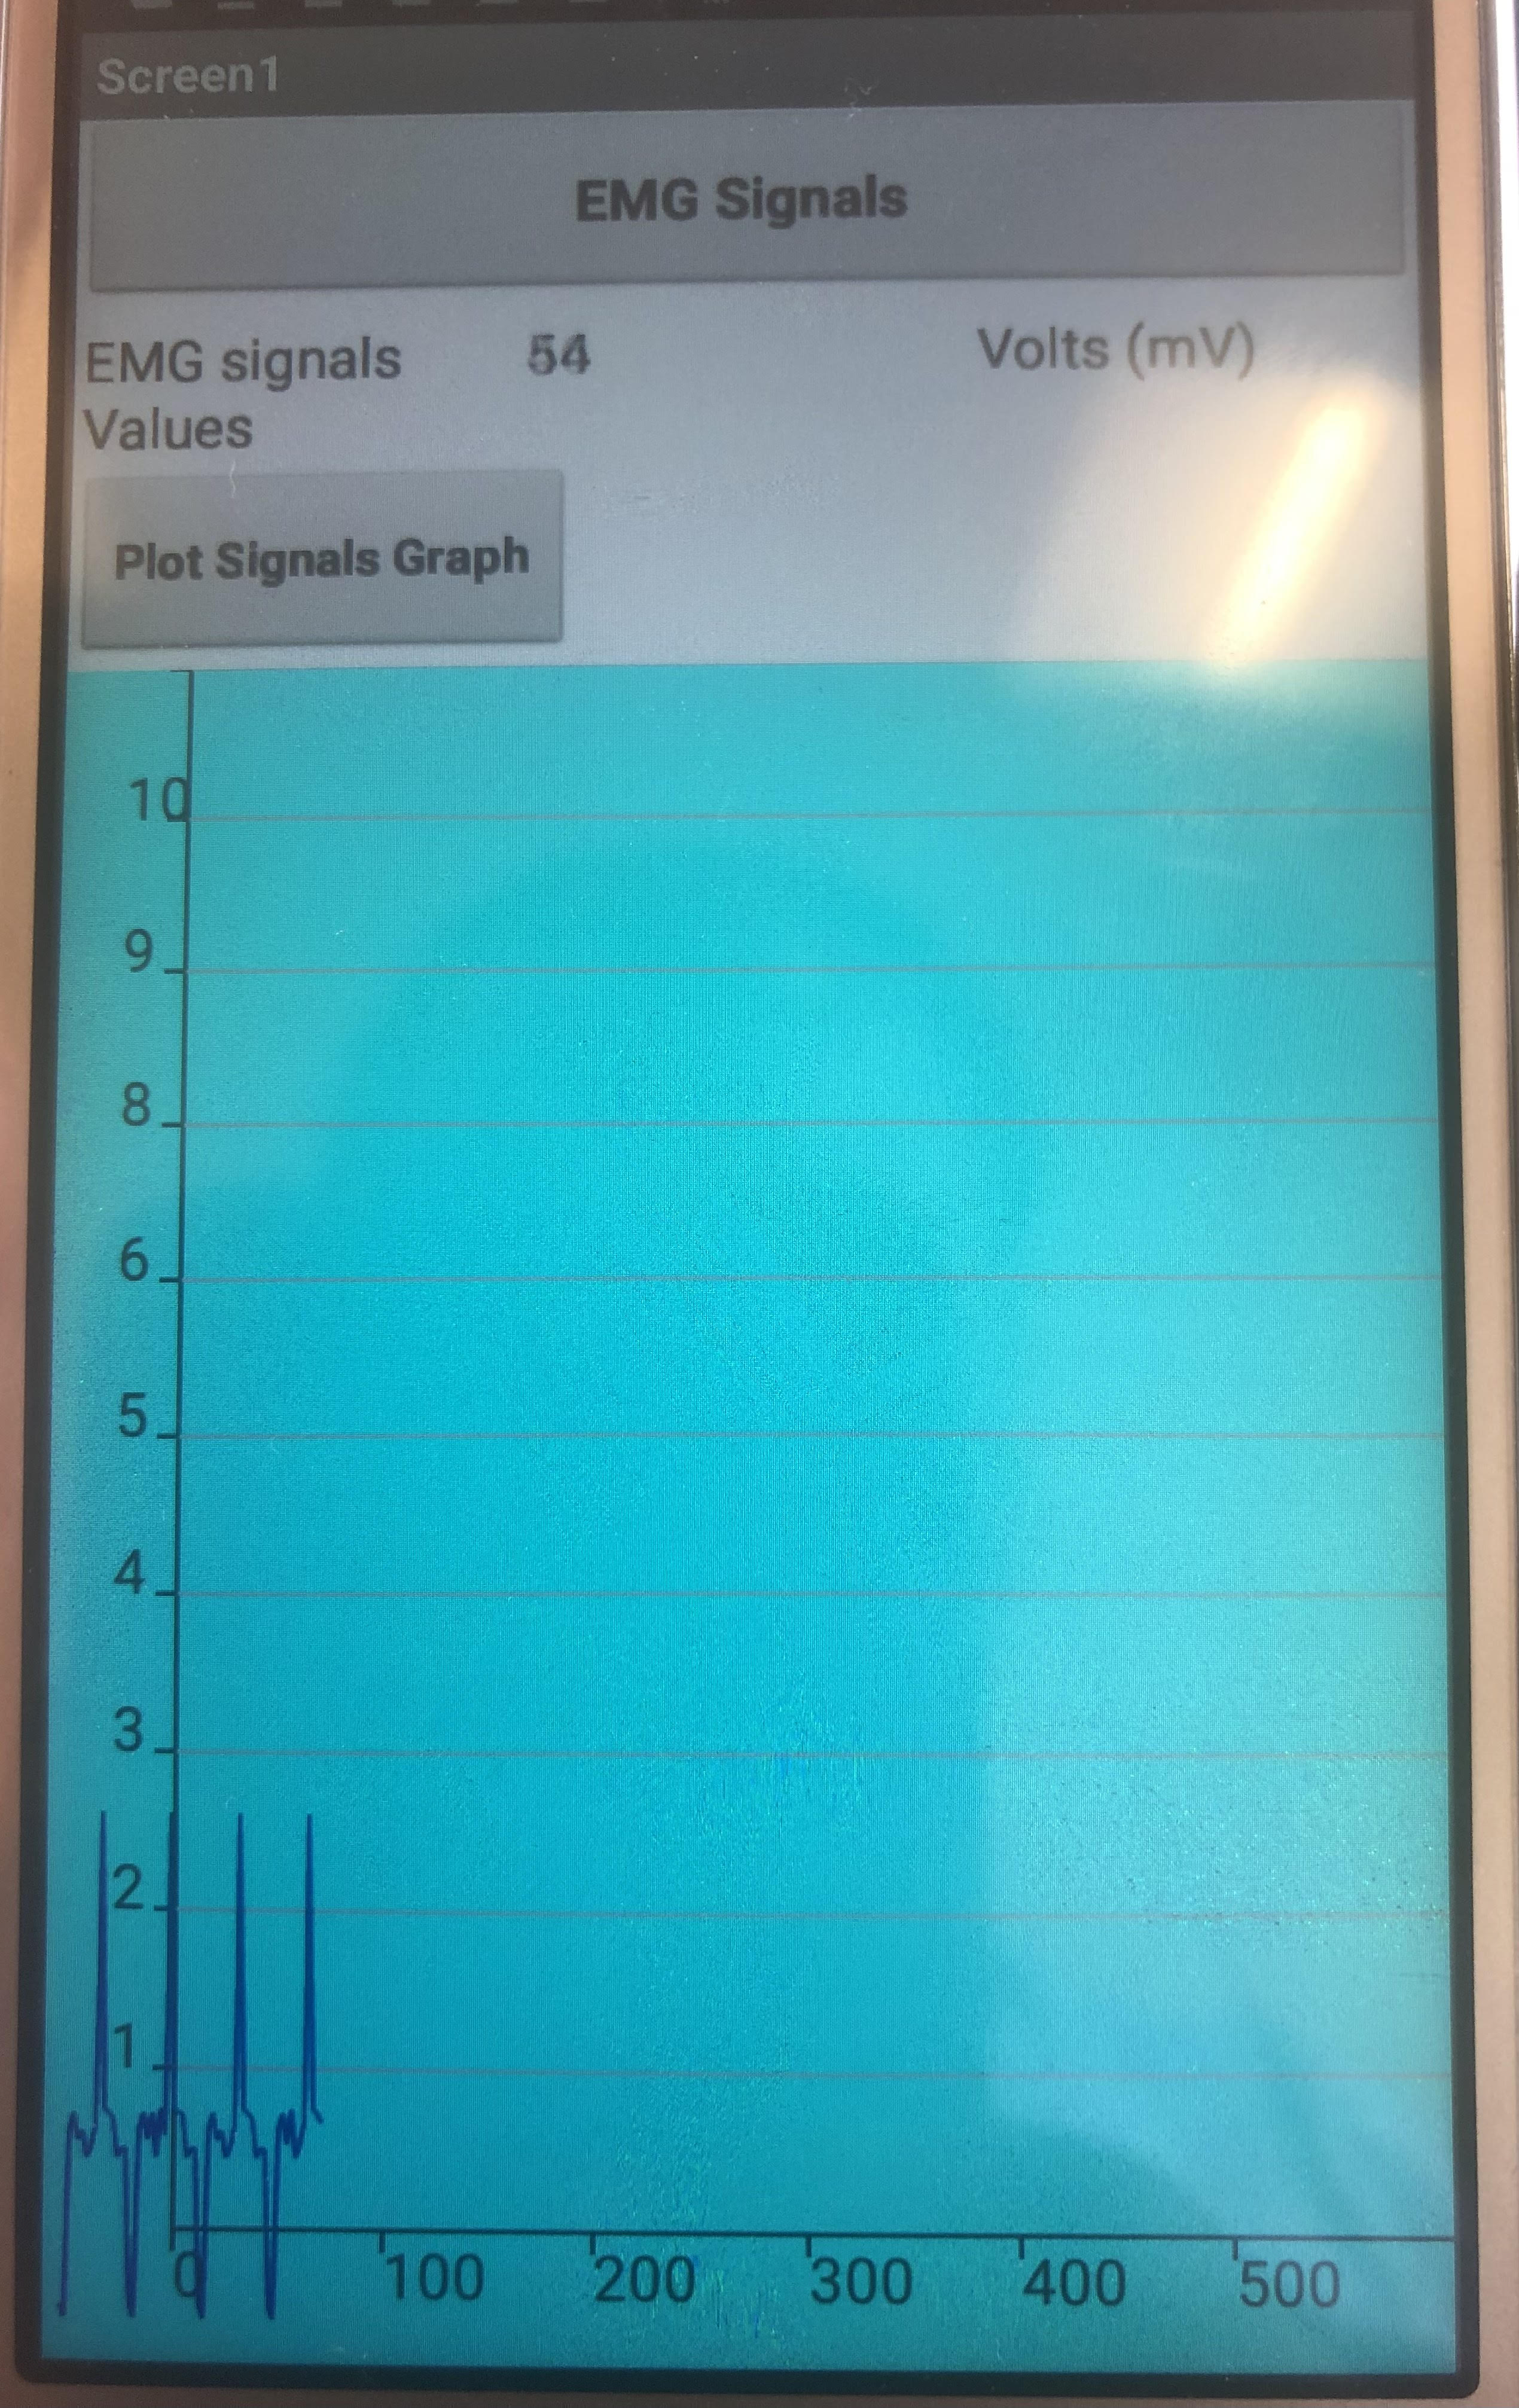
Thanks for the response. What i wanted to do is use a canvas to display the muscle signals on X and Y coordinates on the screen. As the muscles signals is being captured, it should be displayed line graph using the signals.
. Please can you help with the Canvas to display the signals reading on the screen ???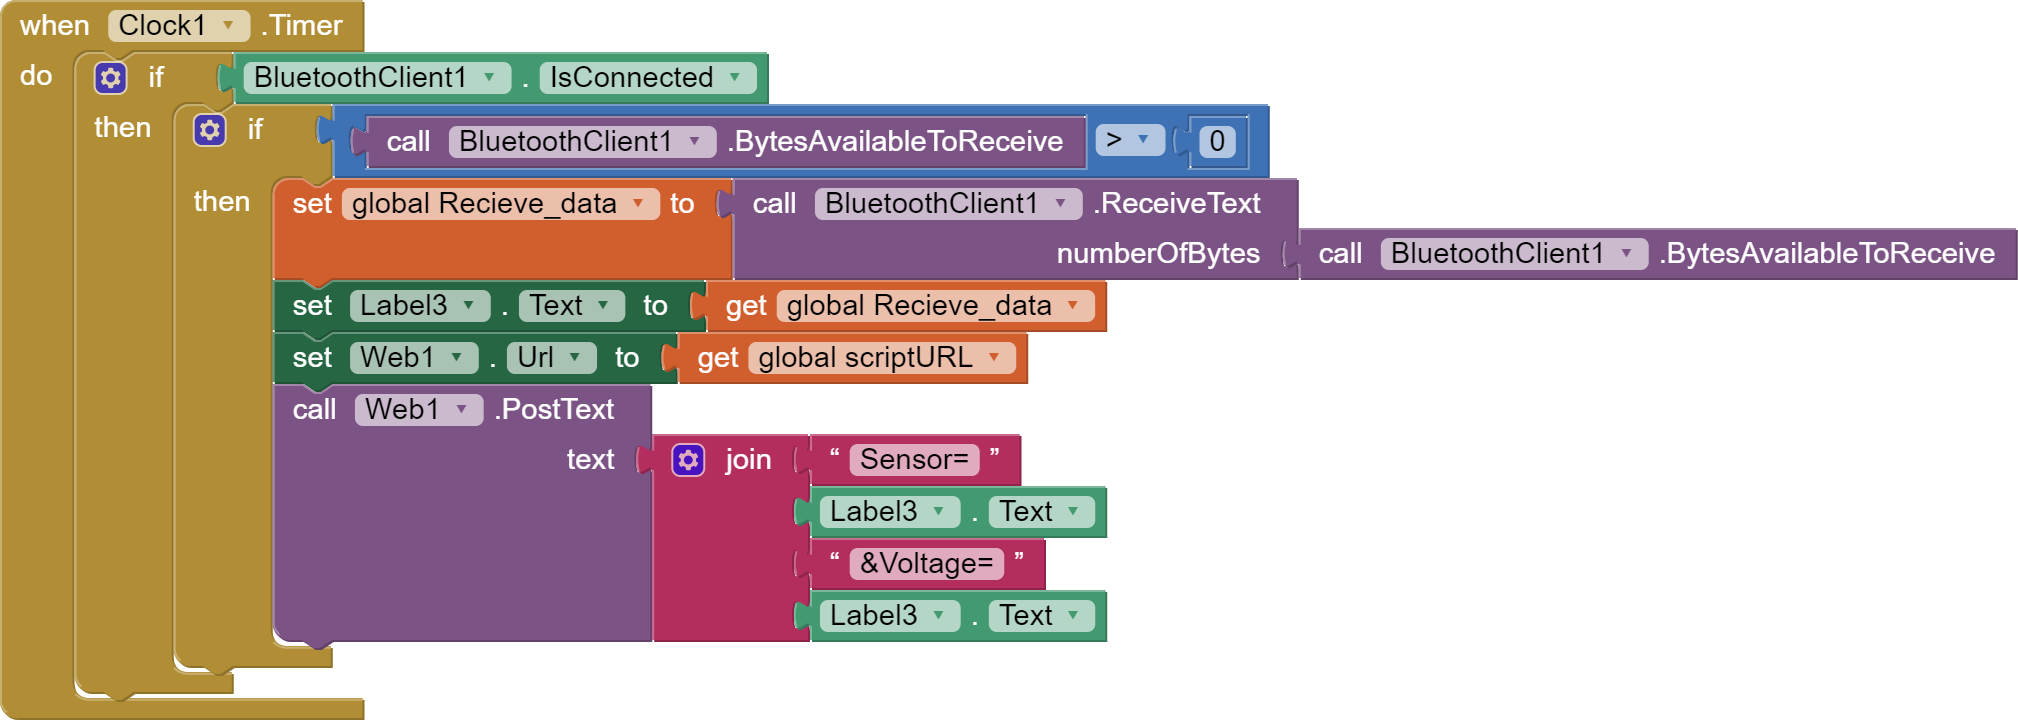
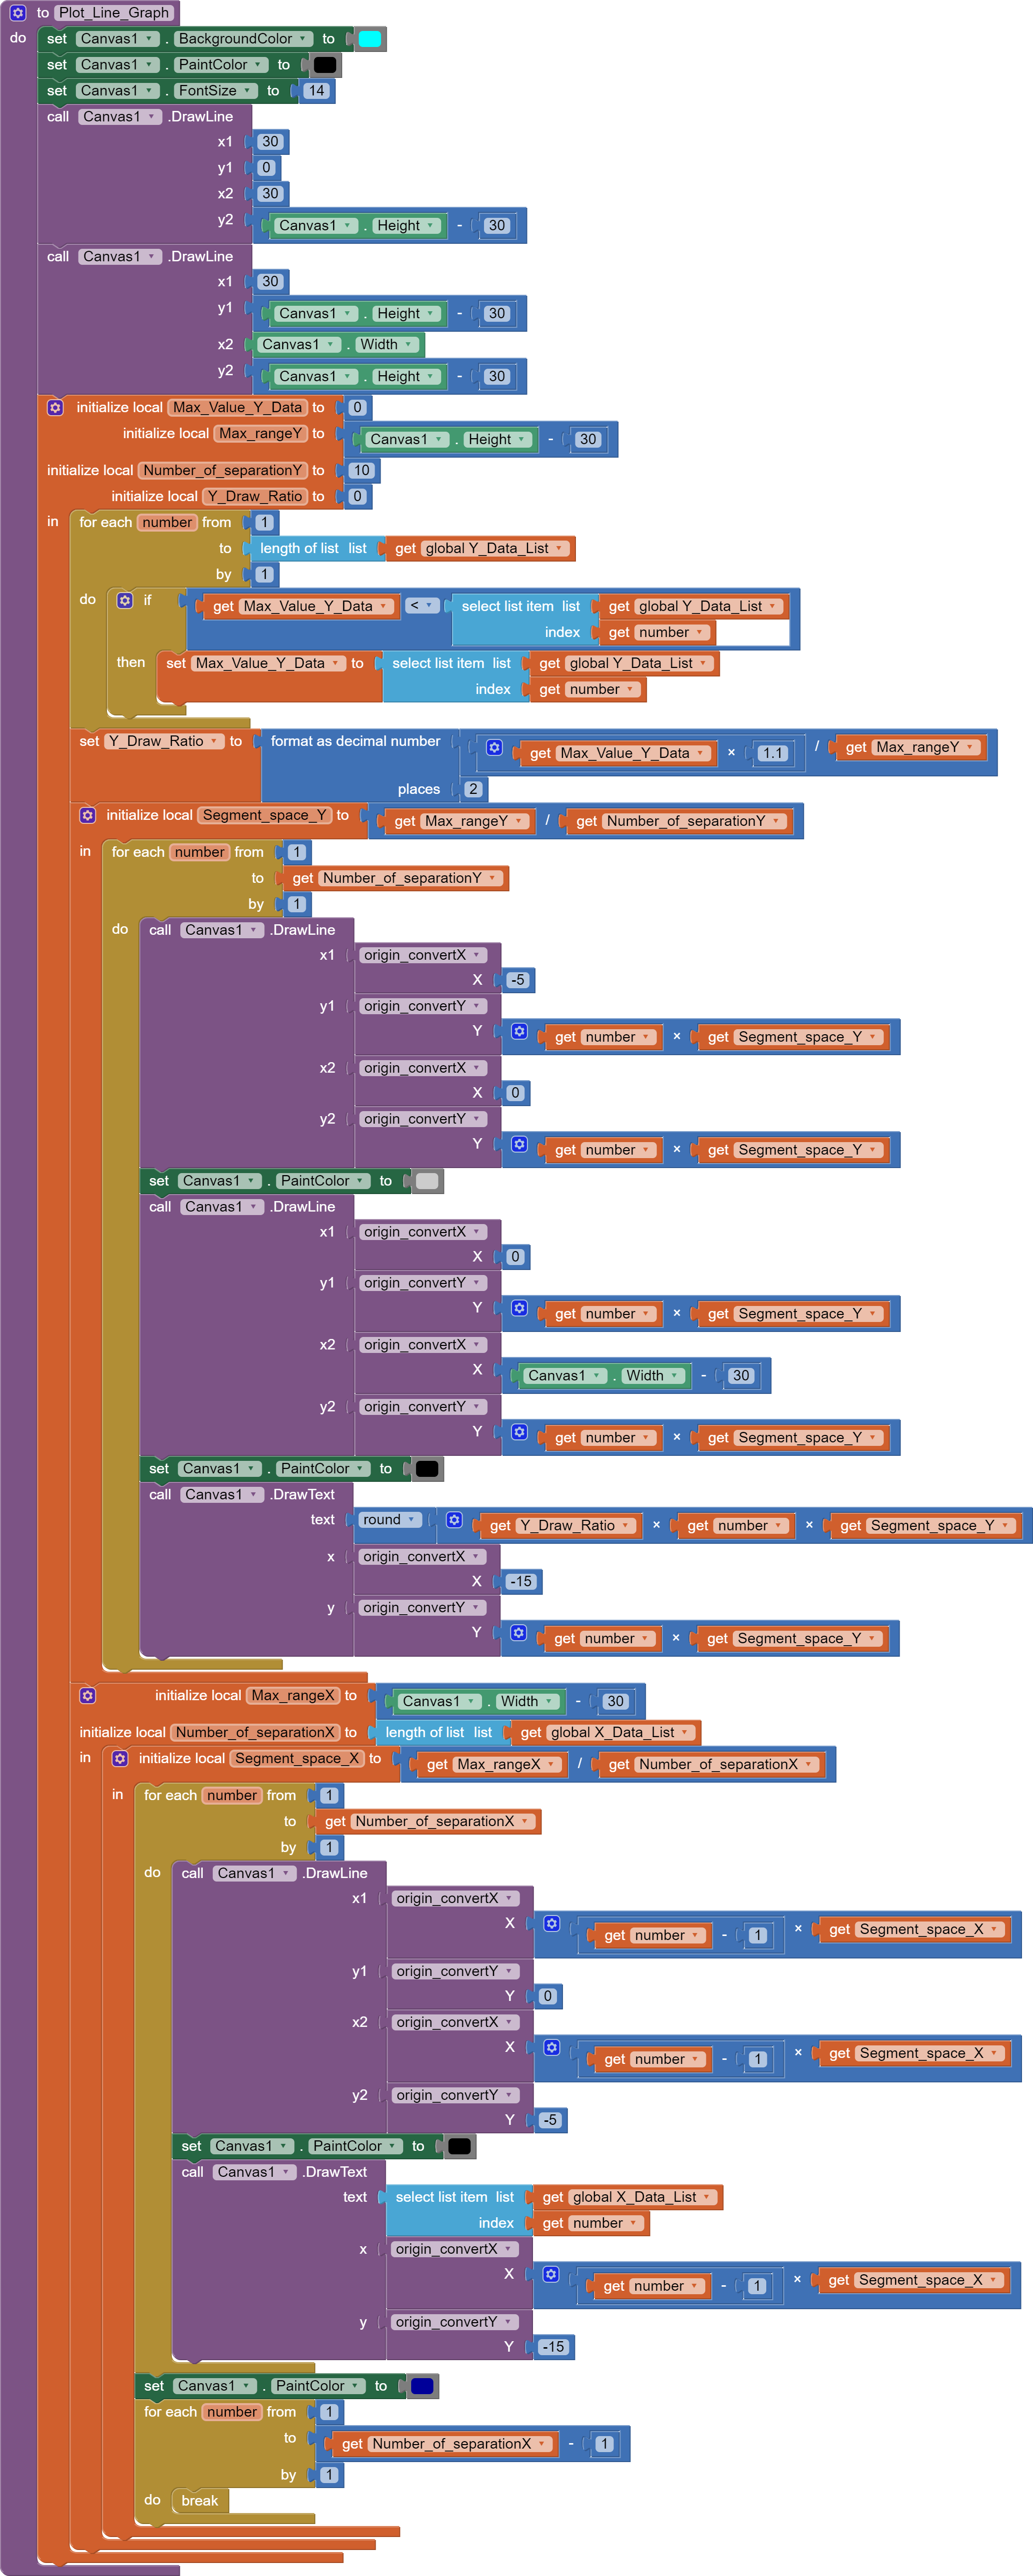
Check examples 9 and 25
Maybe BT and AI2 are too slow to display the graph in real time.
Thank you @Juan_Antonio I would try it out with my app design. I want to be able to display the muscle signals generated on the EMG app in this format. With the signals in continue format.
HI! Did you solve the problem?