Hi, I know this is quite long, but I'm reaching the end of my rope.
I'm working on this project where I receive data from my ESP32 via BLE, save the data in a list, and then I plot that data directly from the list.
The app works like this: I click the button to start receiving the data, I receive the 500 numbers, and then I click "Plot" and I get the graph. So far, so good.
Problem is, if I click the button to start receiving data again, the list with old values won't empty, no matter what I do. Because of this, the graph gets increasingly elongated and takes longer, since, I assume, it has to sort through all the other values as well.
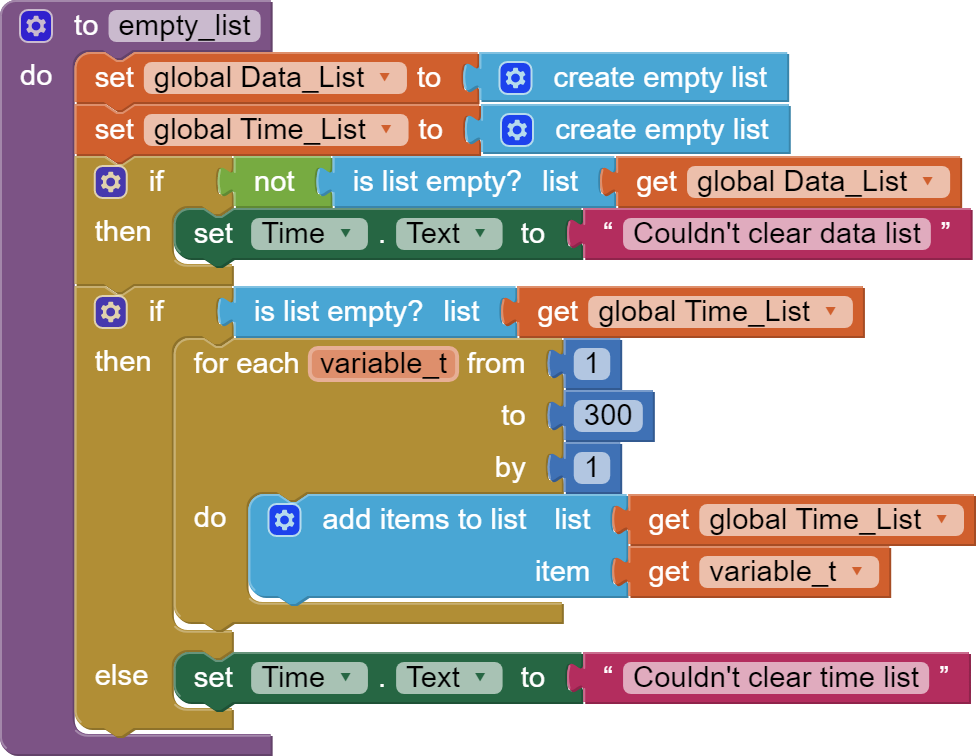
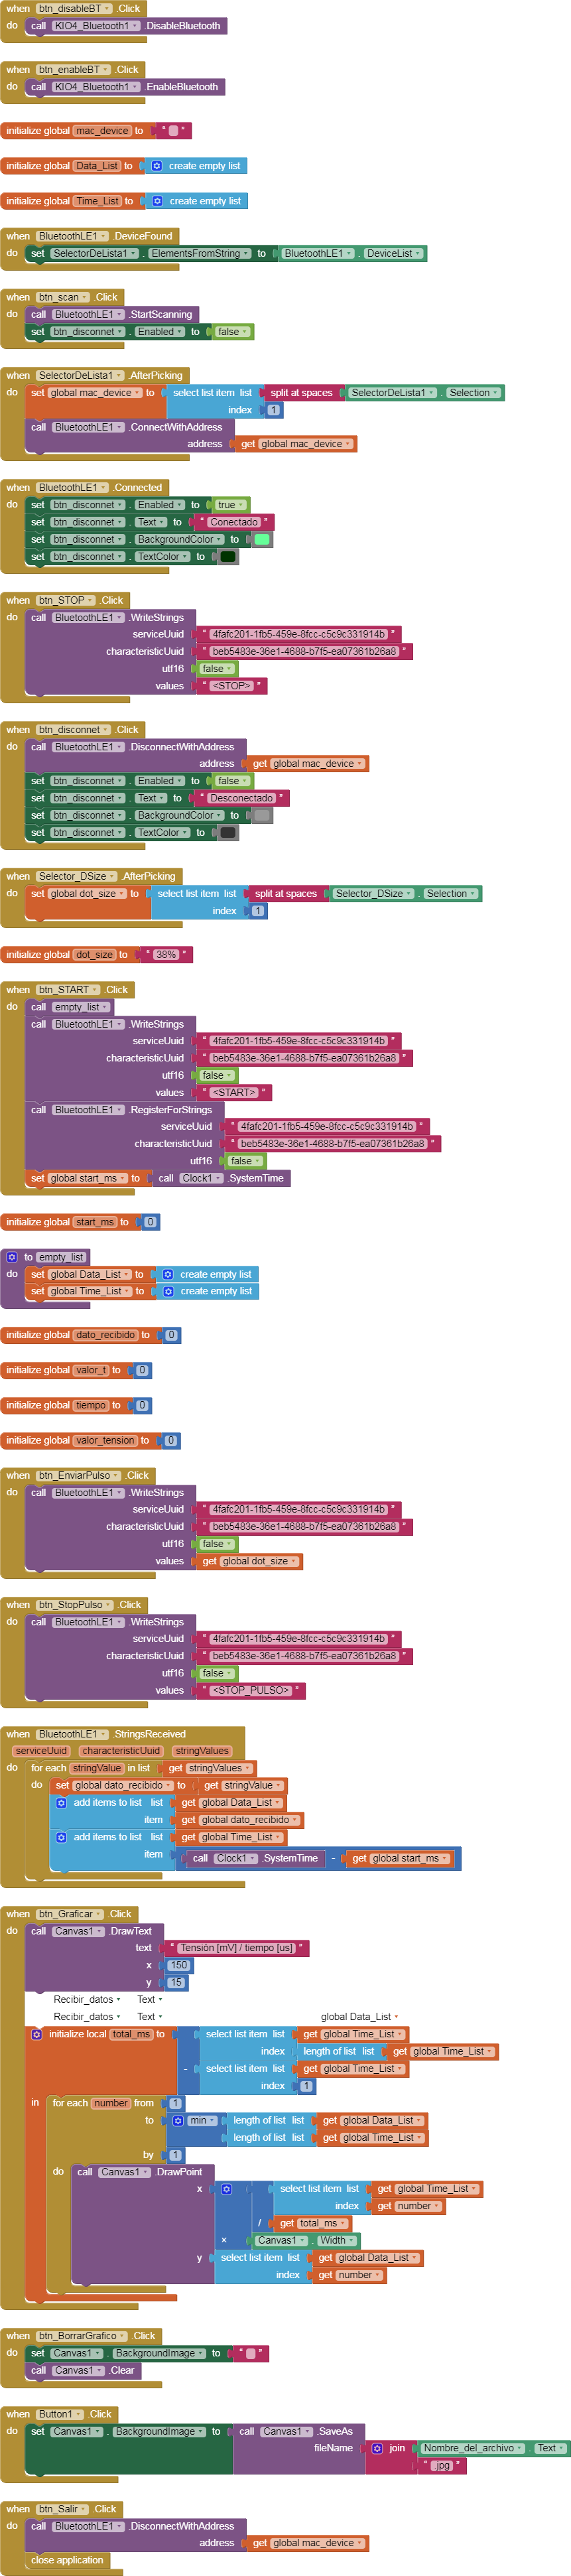
I attach the blocks. The list I can't empty is called "Data_List". I created a procedure called "empty_list" where I initialize the list as empty, but for some reason, I doesn't!
I tried with a for, removing item per item, but it empties half of it (250) and then it says I'm trying to empty from an index that's too large.
Same happened when the list was 200 items long, it only emptied until item 100.
Sorry, I think I'm doing that already?
I have the block "initialize global Data_List to create empty list" right at the top, that's the list I can't clear.
Unless you are referring to another thing. What do you mean by variable holding the list?
(Sorry, I'm a non-native English speaker, and some things fly over my head sometimes)
Please show your relevant blocks so we can see what you are doing
(edit, sorry, didn't see your block image due to incorrect formatting, which is now fixed!)
I'm still struggling with this. I've tried with every method possible, and came to the conclusion that the list might be, in fact, being cleared. Those two text labels I added in the procedure, never appear, so, that's good.
But I don't understand then, why the plot is reducing the amount of samples I get each time!
And so on. Each time I plot, it takes longer and longer to get the graph. Now I'm starting to think it might be something purely related to the Canvas itself?
It's like instead of drawing pixels/dots, now each sample becomes elongated into a line.
I saw multiple places where you were adding x values to the TimeList global variable.
I reworked it to just add an x value to the TimeList when a new item is added to the DataList,
but i did not do anything about checking if your x value ran off the end of the Canvas.
I also rewrote the input handling for proper list item extraction from stringValues, which is a list.
Thank you so much for your work.
I'll try it to see what happens!
The part where I replaced the parentheses in all strings received, was because BLE sends the data like this: (data)
And when I tried to plot that, the canvas took those characters as invalid.
I'll see if it works without it, and if not, I'll add that part again.
Thanks again!
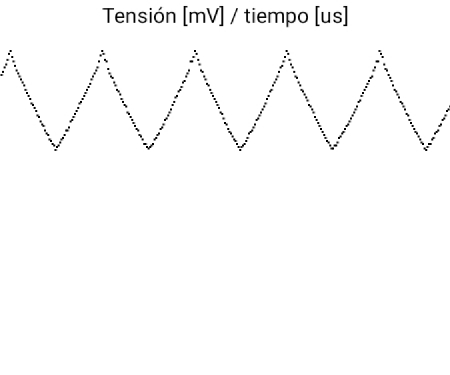
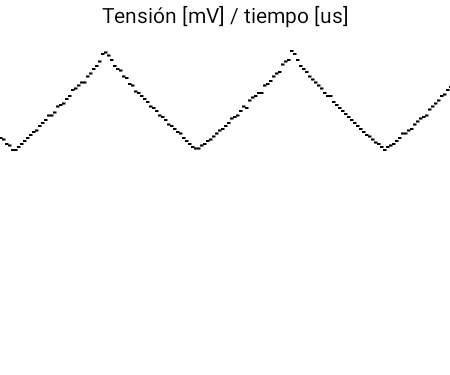
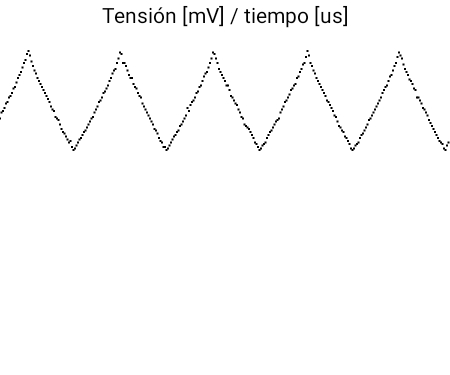
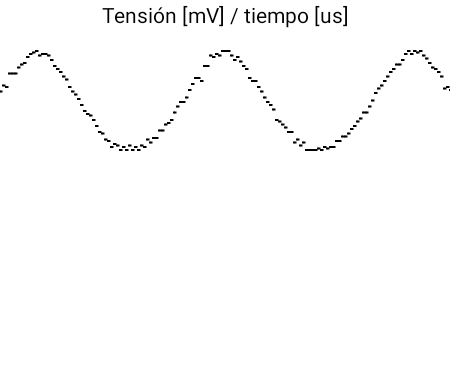
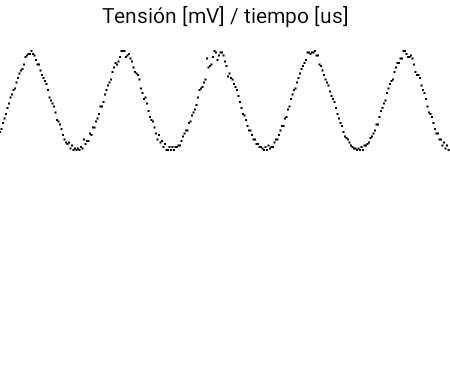
Update: the problem still persists. I tried with different waveforms and the result is the same.
Your graphs look like reasonable sawtooth and sine waves to me.
Here are some more things to consider ...
You don't limit your x values to the width of the Canvas. Solution: in the place where you are going to add an (x,y) pair to your lists, first check if the next x value will exceed width(Canvas1). If greater than Width(Canvas1), set both DataList and TimeList to empty lists before adding x and y values and plotting.
You are using the x coordinate as the sequence number of the incoming data value, without regard to actual elapsed time between data point arrivals. I have no data as to the arrival speed of your data. For all I know, the sending mechanism might be slowing down or speeding up, or your readings might be piling up in a buffer somewhere. One solution to this problem might be to upgrade your plotting logic to that of an actual pre-digital oscilloscope, with two independent mechanisms to sweep an electron beam across a screen, one (x) driven by an internal clock (oscillator), and the other (y) driven by the incoming data. For the x value, I would try mod(Clock1.SystemTime*fudge_factor, Canvas1.Width) where fudge_factor would be some slider value between 10^-3 and 10^3 for tuning in to your desired frequency.
Here is a modification of the capture action to capture time with data value, and the plotting routine to plot relative data arrival times with data values ...
Thank you again for your quick reply. I'll try to set boundaries to the canvas, to see if it's exceeding its width, it looks like it could be the issue.
The data is read with an interrupt, so the time is constant between data points. Because of that, I didn't need to add a timestamp to each data point, since they correspond to the x values (x = 1 equals 1 millisecond, x = 2 equals 2 milliseconds, and so on).
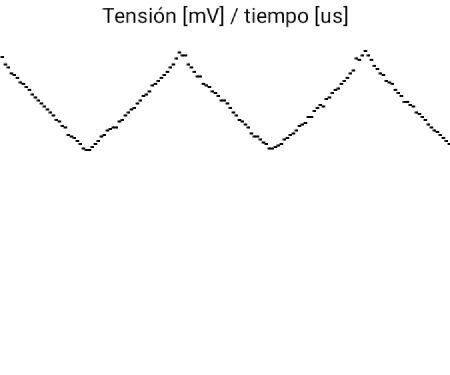
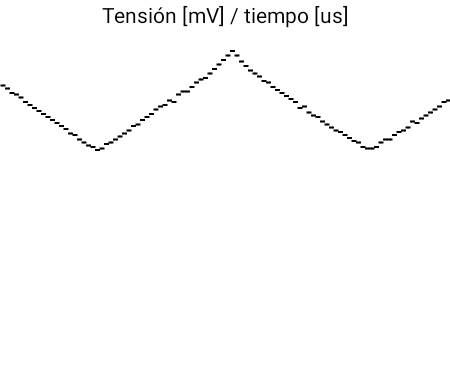
Yes, luckily the shape of the waveforms is good, but each pair of graphs should look the same (in terms of frequency) since I'm plotting the same signal without changing it. But the first time I plot the sine I get 5 peaks, then 2 and a half, and then 1, and so on.
Both for triangular and sine waves, it looks as if it's being "stretched" and half of it is left out of the canvas each time. It's noticeable in the way the dots are no longer dots, but short lines.
.... but you must ensure that the time interval allocated for the App to process each data packet received is approx 20% less than the time interval for data sent - otherwise you will get a buffer over-run, the symptom of which you see now.
Also, ensure the ESP32 is being sufficiently cooled. If it gets too hot, that will also result in a slowing-down of data. Too much heat for too long and your chips will be fried!
Concerning the data being received thus: (data) - why? That looks like extra, unnecessary work for the App
The value of Time_List(length of list(Time_List) would be informative to show in a Label affter your plot. It represents the total time in milliseconds captured.
(Assuming you use my capture code).
That makes sense. What would be the correct way to approach that from the app? Adding a clock timer? Or maybe forcing the app to "wait" in between data adquisition and plotting?
I'll also try to add a bigger delay while sending data in the Arduino code (currently the delay between each data is 3ms, it might be too close to the limit).
I'll keep troubleshooting it some more to find where it's failing.