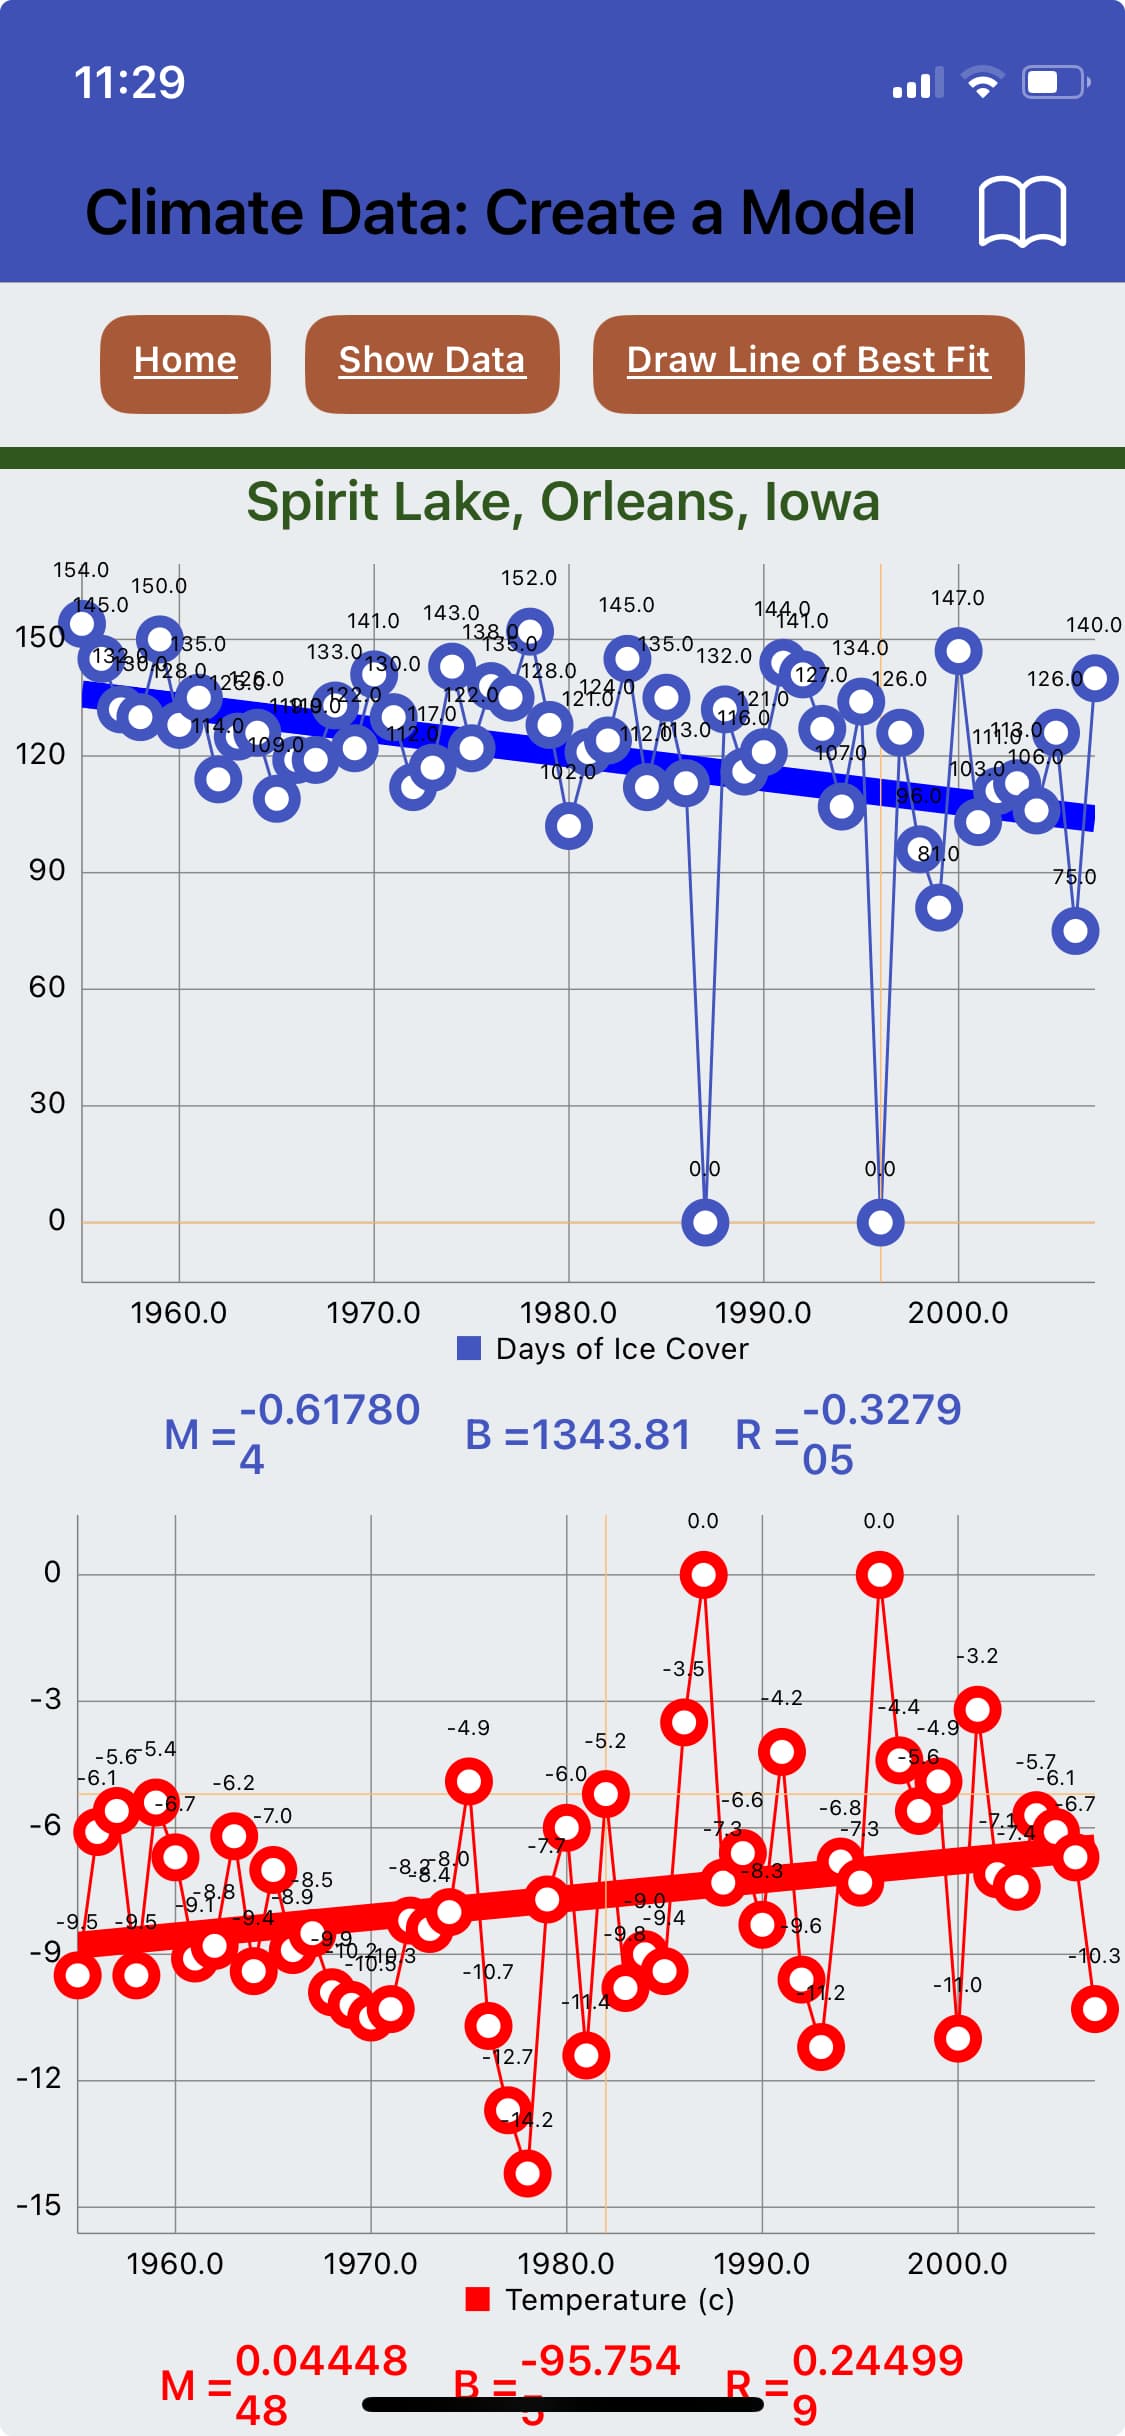
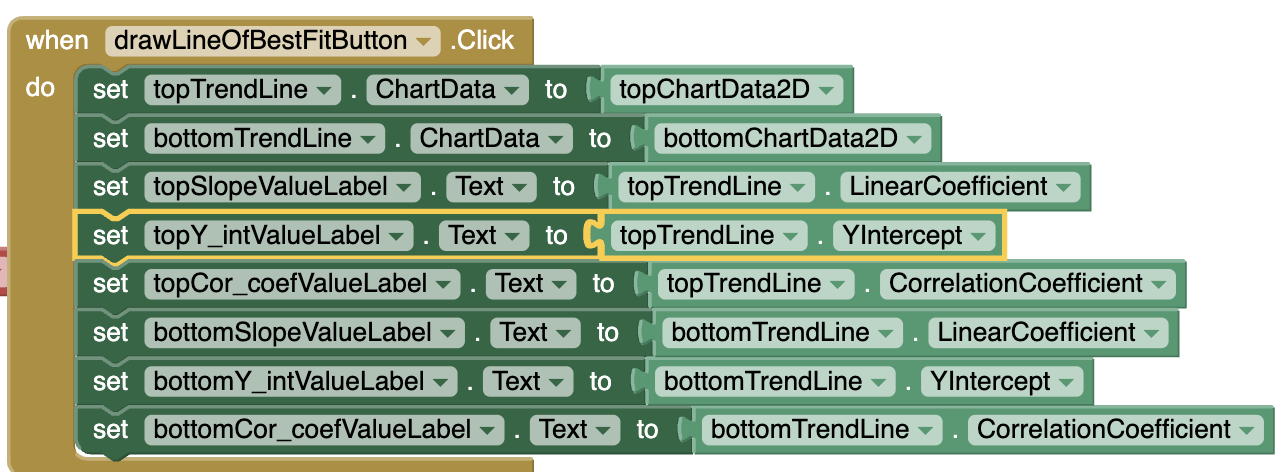
The YIntercept attribute of the Trendline component (from Charts) is 10 times the actual value. Instead of displaying B = 134.381 (for top chart), it displays 1343.81.
Do you have these checked in the Chart component Attributes?
You would need to have these checked if you are trying to read a Y intercept off the displayed axes.
P.S. If that's not it, post an aia with included sample data for us to study.
2 Likes
Oh, of course! Thank you.
I worked up the courage to do the math on your sample.
Let's see what the x,y values from your upper graph endpoints approximate:
x1 = 1955, y1 = 135
x2 = 2005, y2 = 105
So a change of +50 in x yields a change of -30 in y (approximately.)
We want the value of y when x = 0.
That's b in the equation y = mx + b.
That would be
B = y1 + (x1 * (30/50)),
or B = 135 + (1955 * 3/5)
or about 135 + (2000 * .6)
or B = 135 + 1200 = 1315
That's pretty close to the B = 1343.81 I see in the upper graph.
(and you solved it while I trudged through the math)