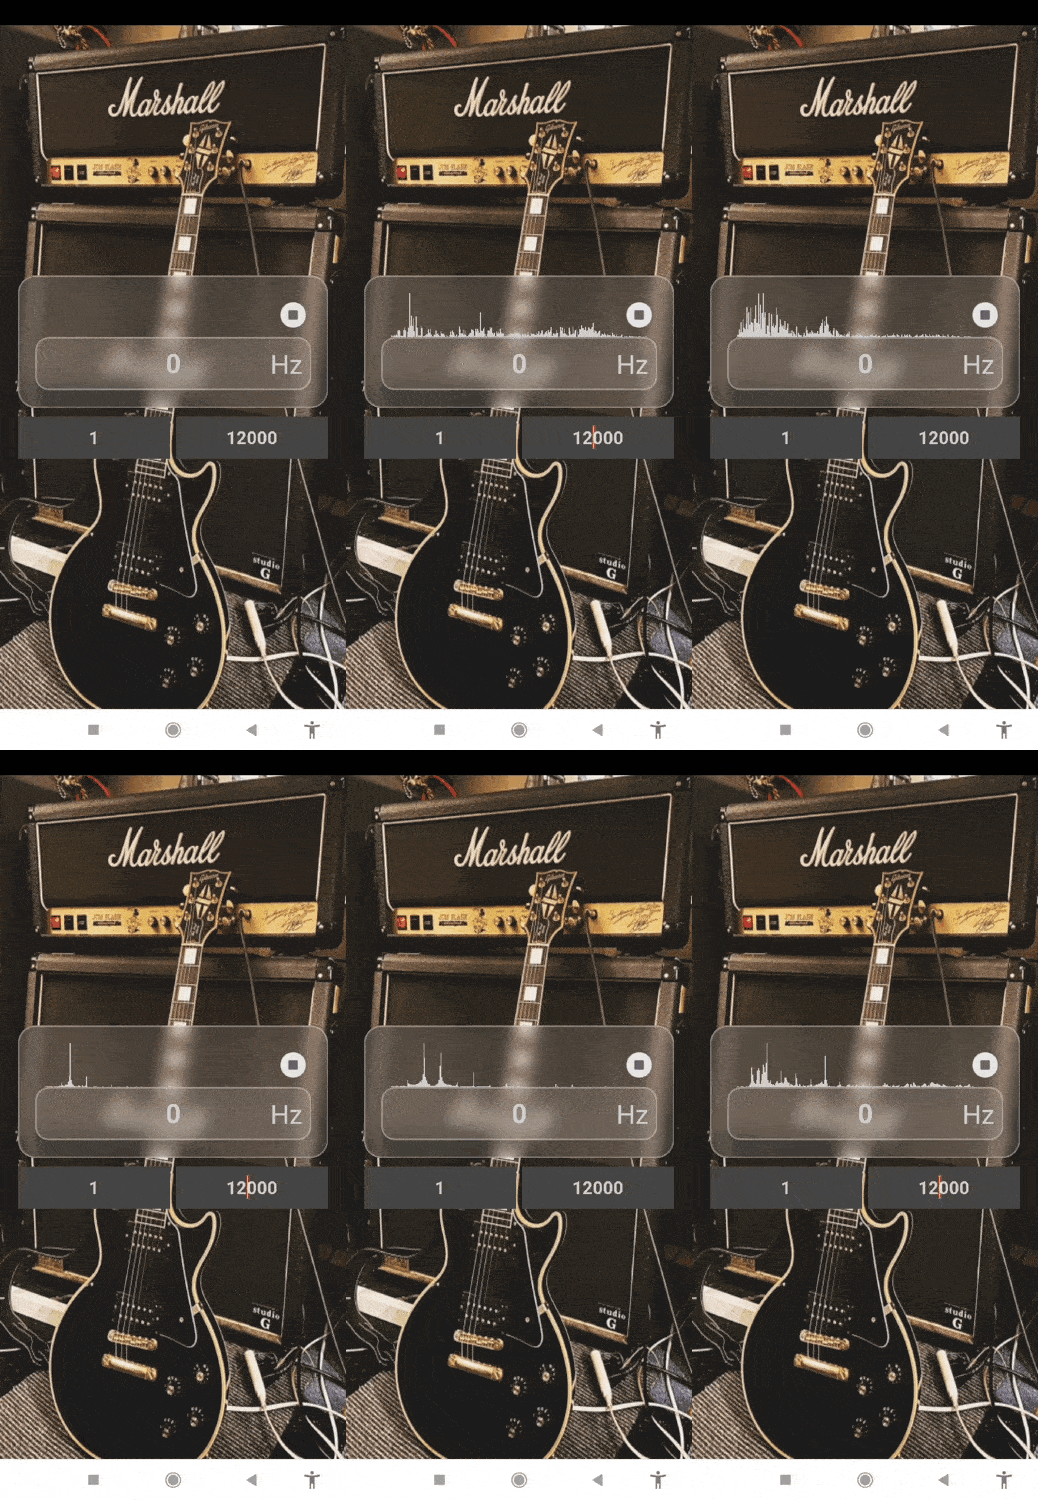
Spectrogram
Based on the audio input captured by the device's microphone.

InitializeSpectrogram
arrangement: Where the spectrogram will be drawn.

StartSpectrogram
This function activates the microphone and calculates the frequency data to draw the bars on the screen and display it in real time

StopSpectrogram
Stops the audio capture and the display of the spectrogram. Frees the resources associated with recording audio.

SetBarColors
Sets the colors for the bars of the spectrogram.
startColor: Initial color of the bars.endColor: End color of the bars.
(built-in colors or ARGB).
SetBackgroundColor
Changes the background color of the spectrogram.
color: The color (built-in colors or ARGB).
SetFrequencyRange
Defines the frequency range to be displayed in the spectrogram.
minFreq: Minimum frequency to display (in Hz). Default value: 0 Hz.maxFreq: Maximum frequency to display (in Hz). Default value: 10,000 Hz.
Maximum value 20,000 Hz
Extension:
joejsanz.joedevspectrogram.aix (10.5 KB)
Thanks.


