SANKEY Diagram for data visualization

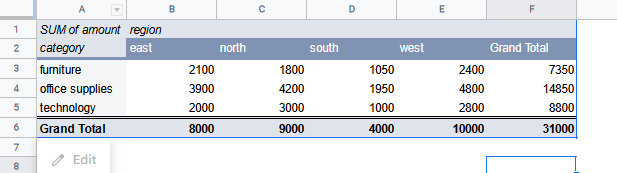
you've just created your cross tabulated summary of sales, categories vs regions,but something seems to be missing.
image

it is hard to see relative differences between categories or between regions.
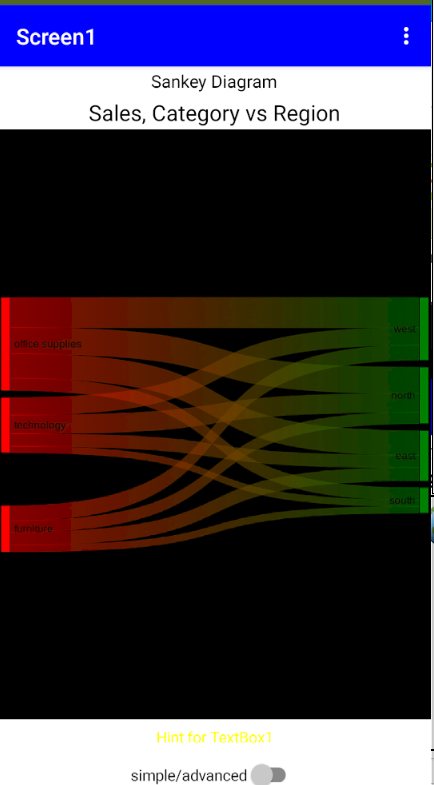
it's time to use a sankey diagram!

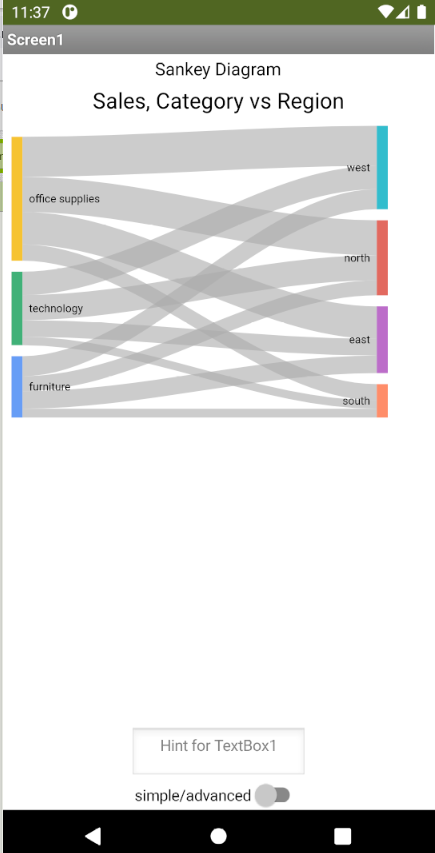
a Sankey diagram is a type of flow diagram used for visualization of material or cost flows. each of the gray bands represents the flow from one node to another and width of the band is proportionate to the total flow. at one glance, you see how the resource is distributed or used across all nodes.

the chart is LIVE! any of the bands is clickable. this is what you get when you click on the topmost band:

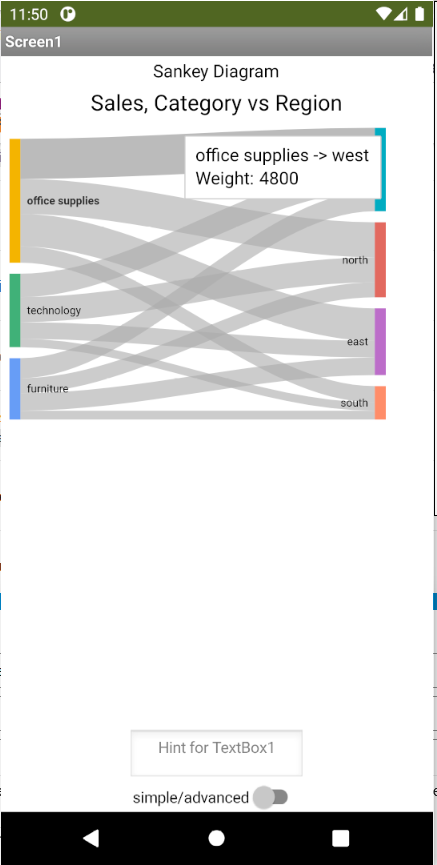
it identifies the origin and destination of the flow and shows the actual quantity of the flow.

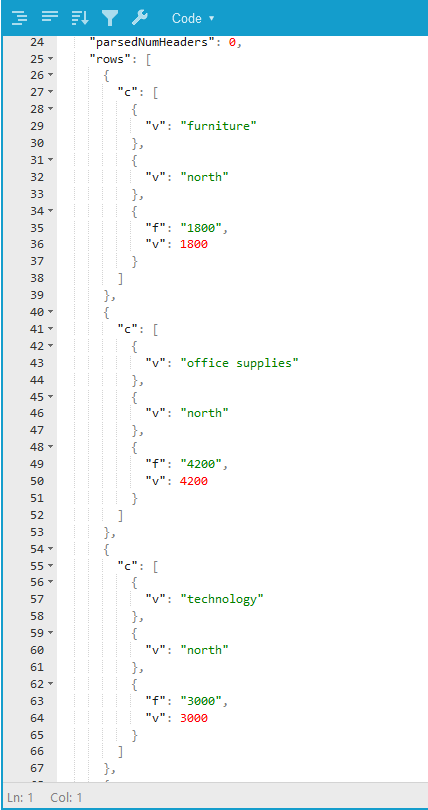
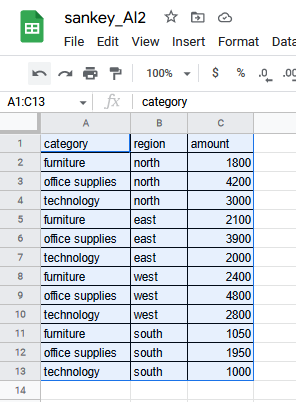
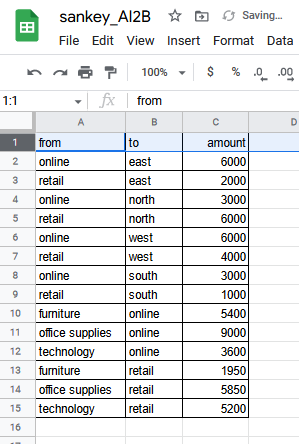
to feed this into my program, you need to encode the data in a google sheet in this format:
image

and you must share the google sheet such that anyone with the link can browse it. in my demo, the sheet id is
1tK5UIg4UKyOtwQgz36-9IzvI1leBMyqxhIwMfK30GQ0

(when you create your own google sheet, you will need to note down the sheet Id because it is used in the program.)

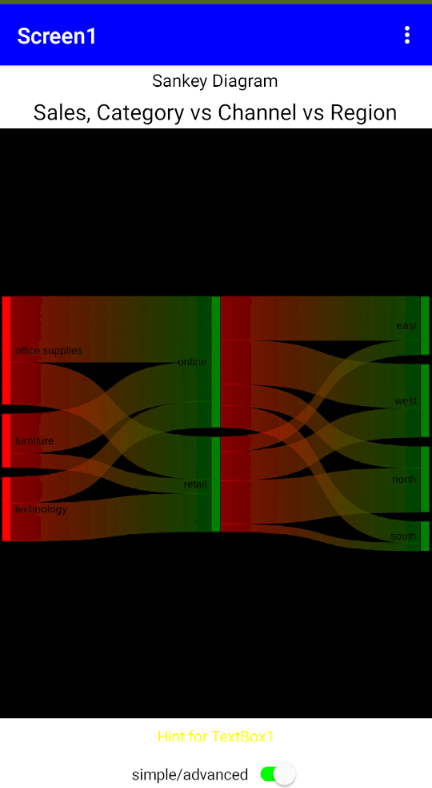
the nice thing about the sankey diagram is that it can easily accommodate another layer of nodes!
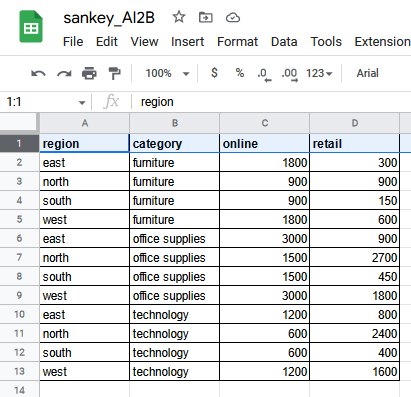
suppose the report data is further "diced" into another grouping, like channel (how the sale was made), it is possible to have an overview report like this.
image

you can visualize this as a sankey diagram like this

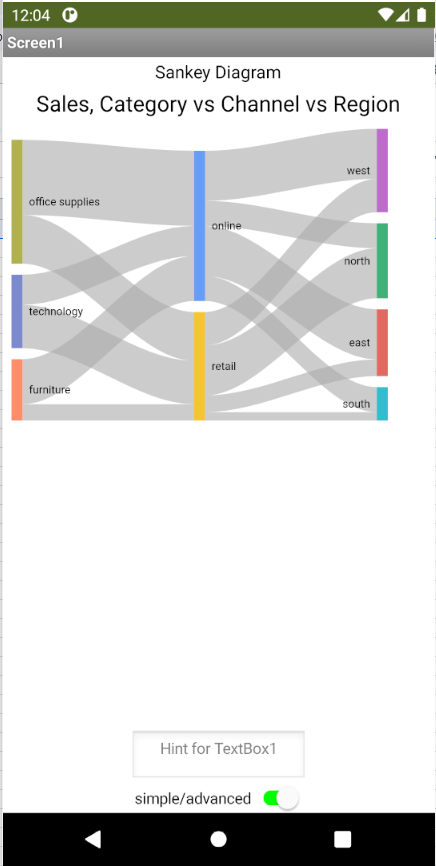
i've included this chart as a bonus in the program. just press the switch labelled "simple/advanced" at the bottom of the screen! note that is is based on another (public) spreadsheet..

in this case, i had to "split" the sankey diagram into 2 frames for encoding - one to represent the flow from category to channel, then another to represent the flow from channel to region, then i concatenated them together. the resulting sheet for input looks like this: sankey will automatically determine the placement of all nodes!

image

the data above is saved in my other (public) sheet with this id.
11GIM0vJ4X65g5japoauCouXmdwj_8AZkHFQx7gPfEuc

so go out there and upgrade that crosstab report with a sankey diagram!

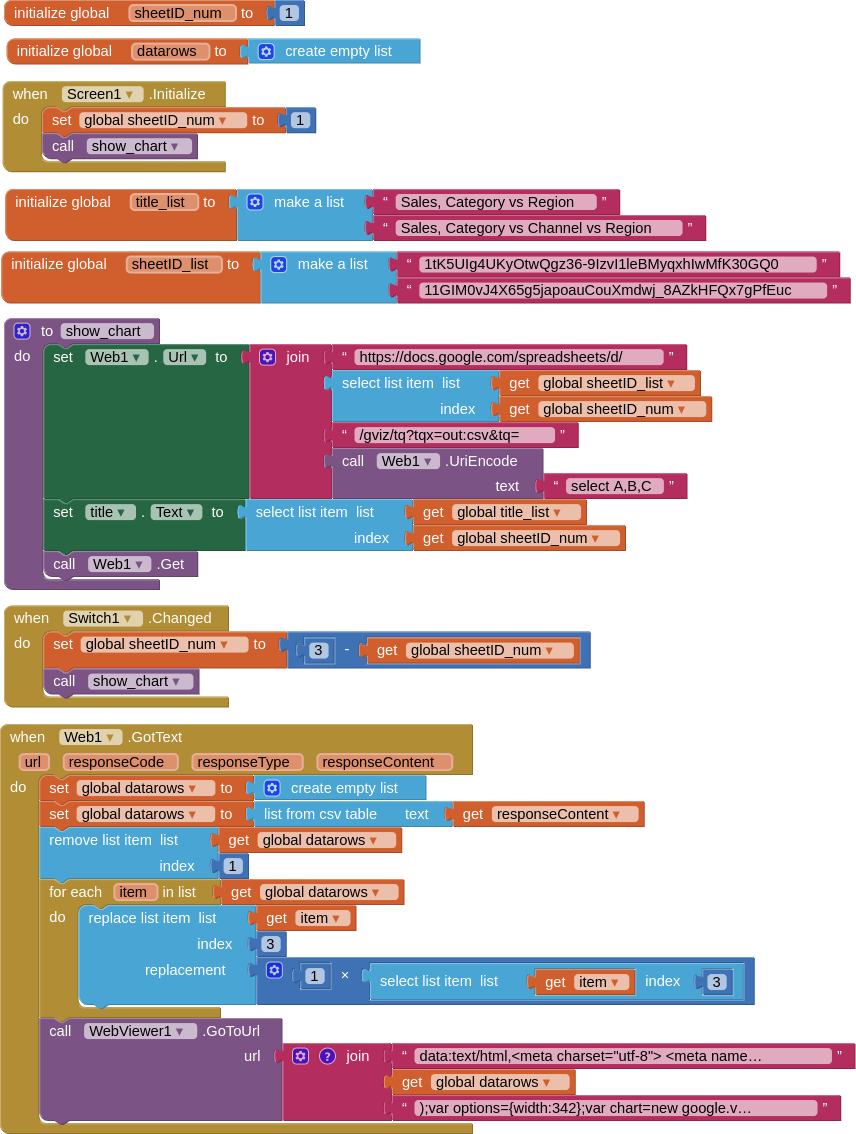
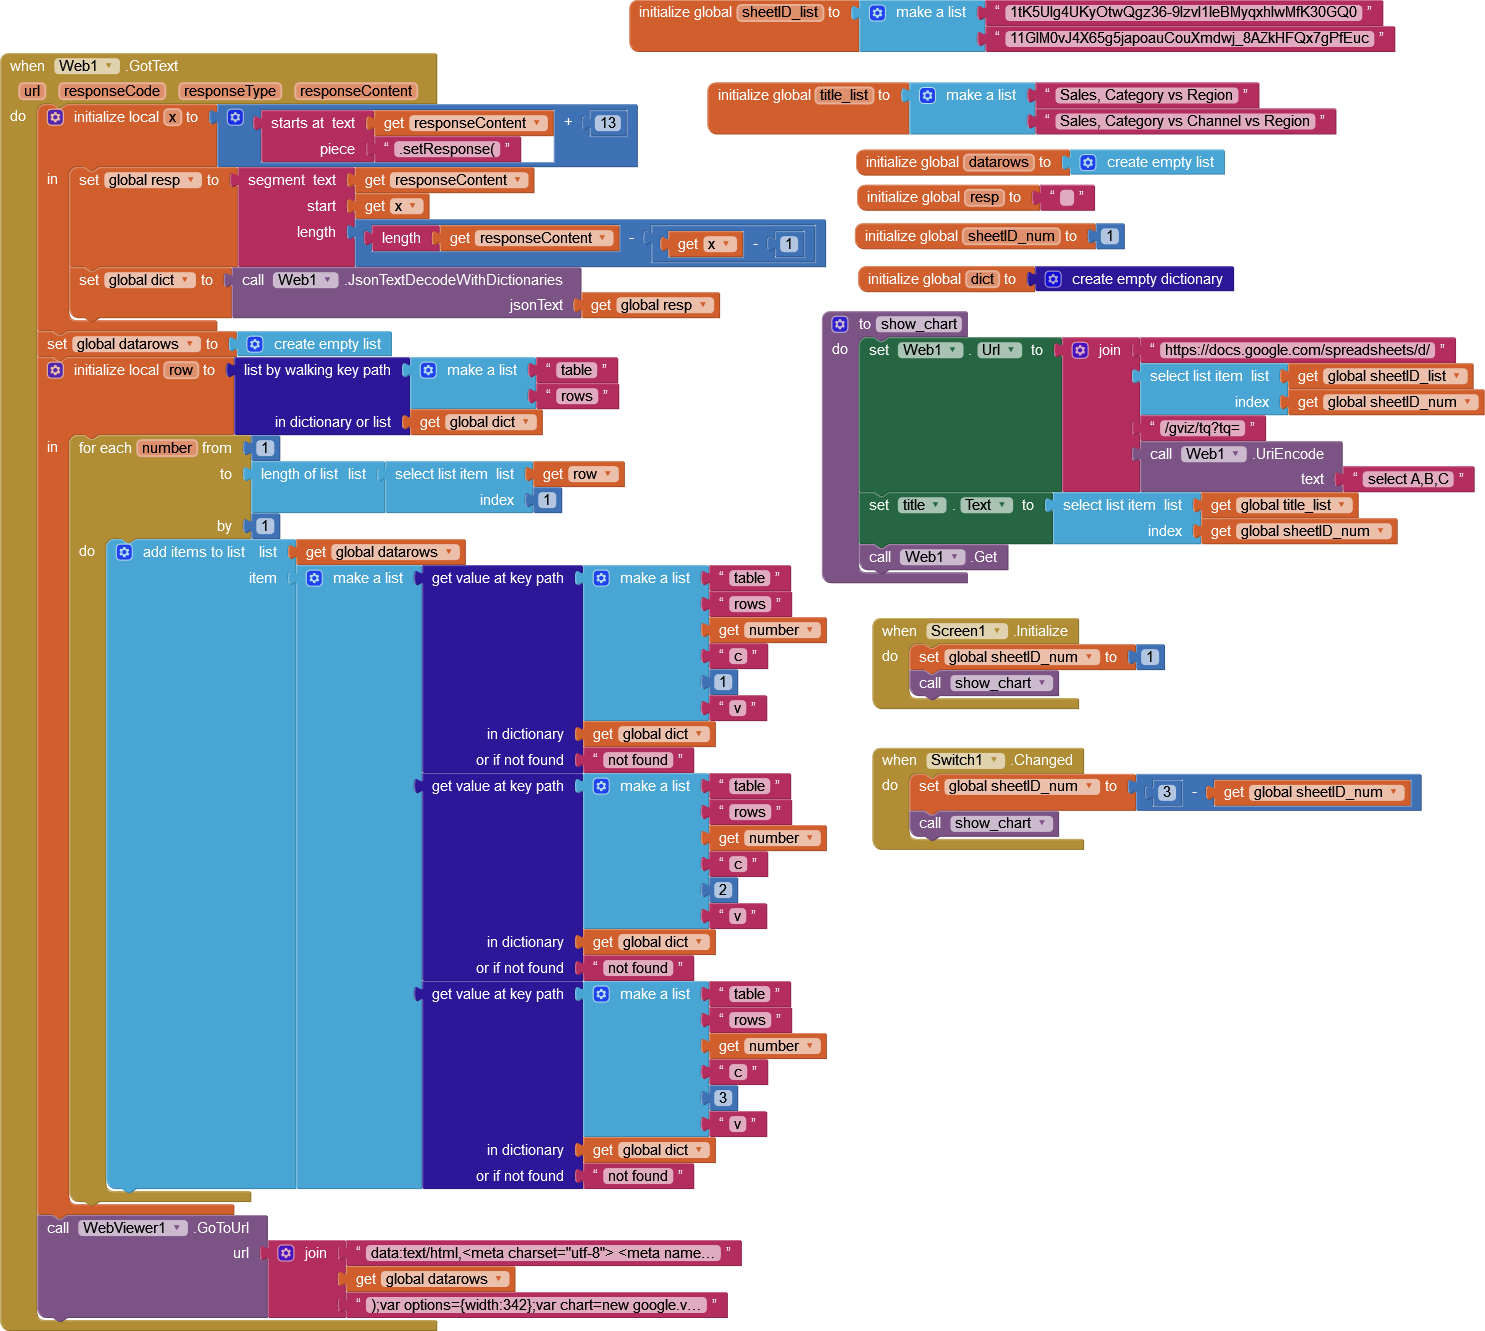
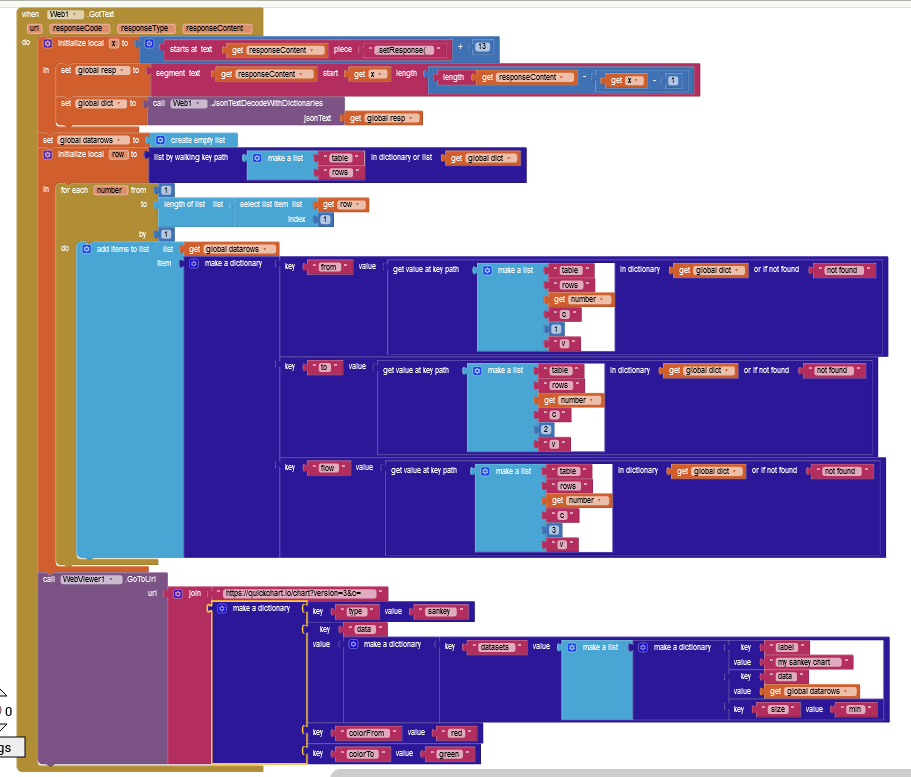
here's a snapshot of the blocks:

and here's the aia
sankey2.aia (5.4 KB)


UPDATE - 9/8/2023
i discovered very recently that Sankey diagrams are now available in quickchart.io - you can find about Sankey diagrams inside the quickchart.io website under Other Charts. (note: the app described above is built via a call to google chart).

i've made a new copy of the program and replaced its charting component with a call to quickchart.io and here are some screen shots:

Two-level Sankey diagram:

Three-level Sankey diagram:

Personally, i'm not in favor of this "dark mode" i'm probably not aware of all the available settings. Also, the charts produced by google charts seem prettier. (just my impresssion)

this is a screen shot of the charting component blocks.

And here is the aia version of the program:
mit_sankey_qc.aia (5.9 KB)

3 Likes

Looks nice. Could you also provide the blocks and a aia for others to study how you did it? Is the Sankey diagram part of Google Sheets? I couldn't find it?

it is not part of google sheets per se , but it is part of google charts. it's one of many chart types.

A Sankey diagram is a wonder to behold.

That part where you clip exactly 48 characters from the front of responseContent bothered me, so I grabbed the text to see if there is a more robust way .

Do It Result: "/*O_o*/
google.visualization.Query.setResponse({"version":"0.6","reqId":"0","status":"ok","sig":"1841285754","table":{"cols":[{"id":"A","label":"category","type":"string"},{"id":"B","label":"region","type":"string"},{"id":"C","label":"amount","type":"number","pattern":"General"}],"rows":[{"c":[{"v":"furniture"},{"v":"north"},{"v":1800.0,"f":"1800"}]},{"c":[{"v":"office supplies"},{"v":"north"},{"v":4200.0,"f":"4200"}]},{"c":[{"v":"technology"},{"v":"north"},{"v":3000.0,"f":"3000"}]},{"c":[{"v":"furniture"},{"v":"east"},{"v":2100.0,"f":"2100"}]},{"c":[{"v":"office supplies"},{"v":"east"},{"v":3900.0,"f":"3900"}]},{"c":[{"v":"technology"},{"v":"east"},{"v":2000.0,"f":"2000"}]},{"c":[{"v":"furniture"},{"v":"west"},{"v":2400.0,"f":"2400"}]},{"c":[{"v":"office supplies"},{"v":"west"},{"v":4800.0,"f":"4800"}]},{"c":[{"v":"technology"},{"v":"west"},{"v":2800.0,"f":"2800"}]},{"c":[{"v":"furniture"},{"v":"south"},{"v":1050.0,"f":"1050"}]},{"c":[{"v":"office supplies"},{"v":"south"},{"v":1950.0,"f":"1950"}]},{"c":[{"v":"technology"},{"v":"south"},{"v":1000.0,"f":"1000"}]}],"parsedNumHeaders":0}});"

I could not find where that

/*O_o*/ 

came from and I hate counting, so I suggest searching for the .setResponse( in front and ); behind to isolate the JSON text response.

See how to get a better/different data return from a gviz query here:

(added to FAQ)

Another option I've played around with for Sankey diagrams is SankeyMatic, which is open source in Javascript on GitHub:

Your blocks could have been more simple if you had used tqx=out:csv in your query....

All that was then needed was to convert the the "text" "numbers" to numbers.

thanks for pointing this out to me - in this case, this approach is simpler.

however in the general case i still feel comfortable processing the returned dictionary. eg.

{"reqId":"0","sig":"1841285754","status":"ok","table":{"cols":[{"id":"A","label":"category","type":"string"},{"id":"B","label":"region","type":"string"},{"id":"C","label":"amount","pattern":"General","type":"number"}],"parsedNumHeaders":0,"rows":[{"c":[{"v":"furniture"},{"v":"north"},{"f":"1800","v":1800}]},{"c":[{"v":"office supplies"},{"v":"north"},{"f":"4200","v":4200}]},{"c":[{"v":"technology"},{"v":"north"},{"f":"3000","v":3000}]},{"c":[{"v":"furniture"},{"v":"east"},{"f":"2100","v":2100}]},{"c":[{"v":"office supplies"},{"v":"east"},{"f":"3900","v":3900}]},{"c":[{"v":"technology"},{"v":"east"},{"f":"2000","v":2000}]},{"c":[{"v":"furniture"},{"v":"west"},{"f":"2400","v":2400}]},{"c":[{"v":"office supplies"},{"v":"west"},{"f":"4800","v":4800}]},{"c":[{"v":"technology"},{"v":"west"},{"f":"2800","v":2800}]},{"c":[{"v":"furniture"},{"v":"south"},{"f":"1050","v":1050}]},{"c":[{"v":"office supplies"},{"v":"south"},{"f":"1950","v":1950}]},{"c":[{"v":"technology"},{"v":"south"},{"f":"1000","v":1000}]}]},"version":"0.6"}

it looks difficult to parse but if you paste this to a json beautifier like https://jsonformatter.org/, the structure becomes apparent. the whole worksheet data is represented as a matrix consisting of an array of rows, and each row contains an array of all the columns so you have total control on how to process the data.
here's what the first 3 rows looks like:

i can see how useful this representation would be for a report showing sales for all 12 months going across. you can index into the columns array of any row directly instead of testing each month by name.

anyway thanks for showing me this technique. now i know 2 ways of processing spreadsheet data in a structured way!

thanks for the suggestion -i've fixed my program so it looks for '.setResponse(' and select the reponse starting beyond that point. i;ve updated the orignal post with the new versions of aia and snapshot.
thanks.

i tried it and played with it - it's pretty responsive and you can adjust every single thing!