Hi there everyone!
I am currently learning how to use MIT app and have met with a problem
I want to plot a line graph with all the sensor data I have sent to a server through the access point and display it in my app, displaying the individual data was fine however I can't seem to plot the graph out.
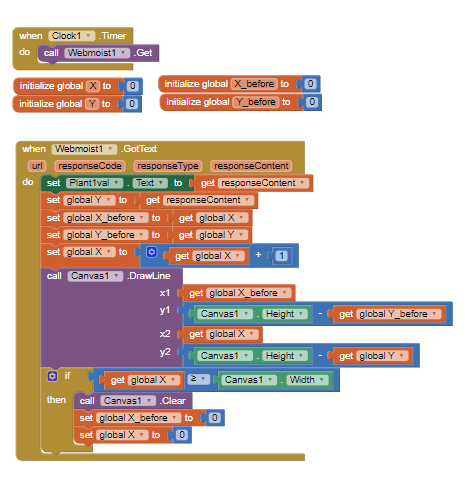
So what I did was increased the "X" value for each loop so I could plot over the entire graph. Once the "Y" data is saved then can create a line between previous and present data using the DrawLine block. In that block, the height bust is the total height of the graph minus the received data. I also check if X have reached the maximum width of the graph. If yes, reset the Canvas and start plotting once again from the beginning of the graph and also reset the "X" values to 0.
But it does not seem to work, attached is the code
Can anyone help and see if i have done any of it wrongly?
Thank you in advance!