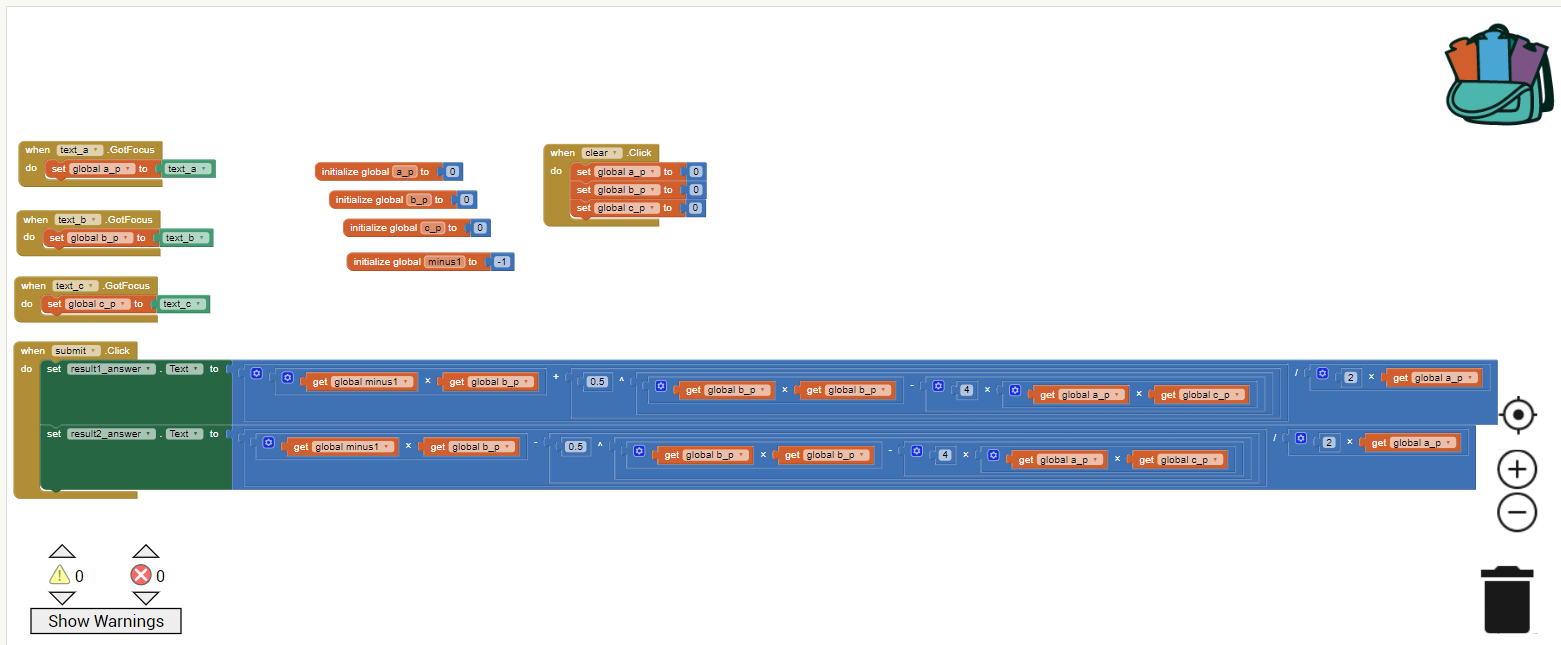
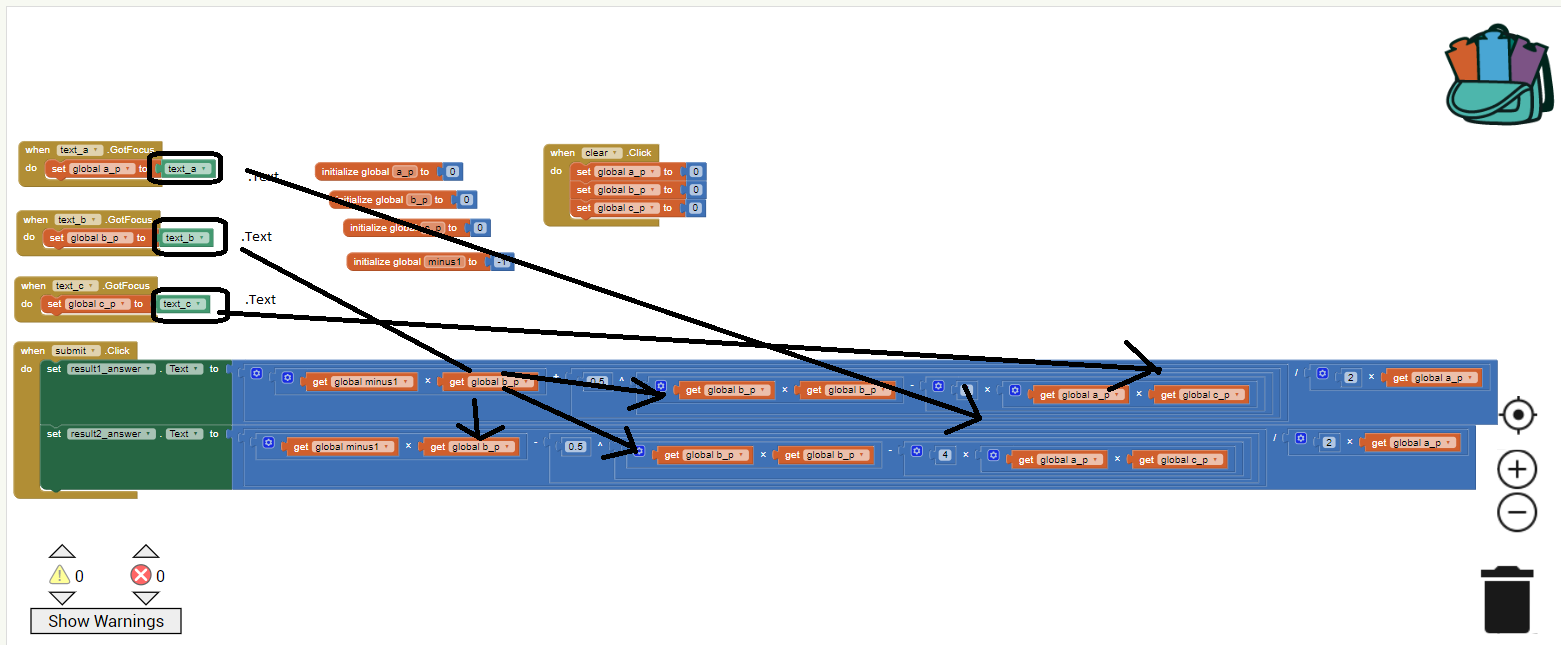
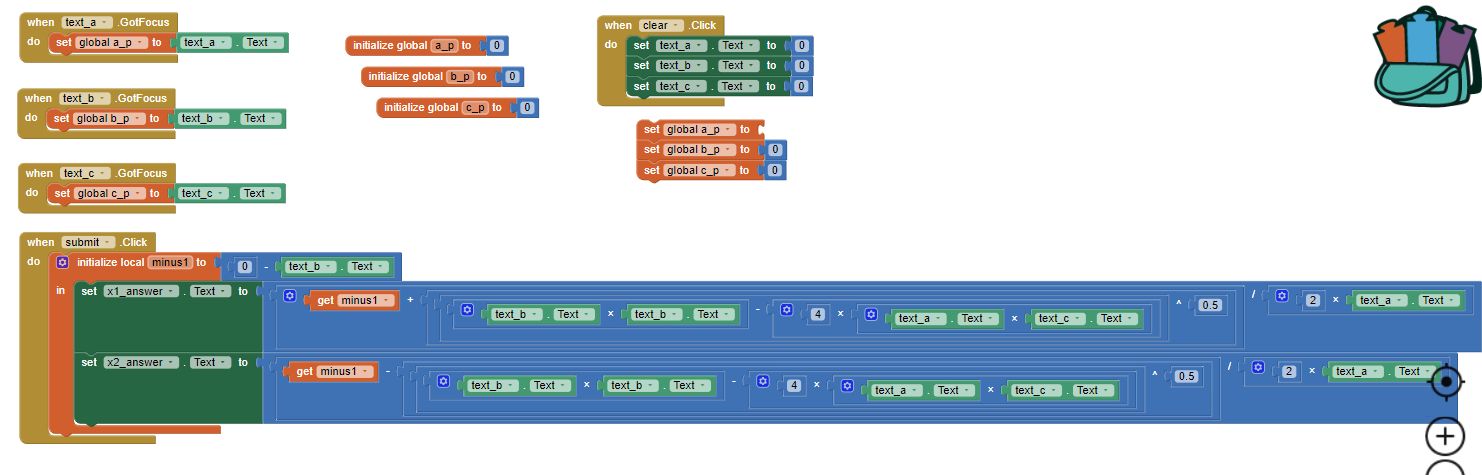
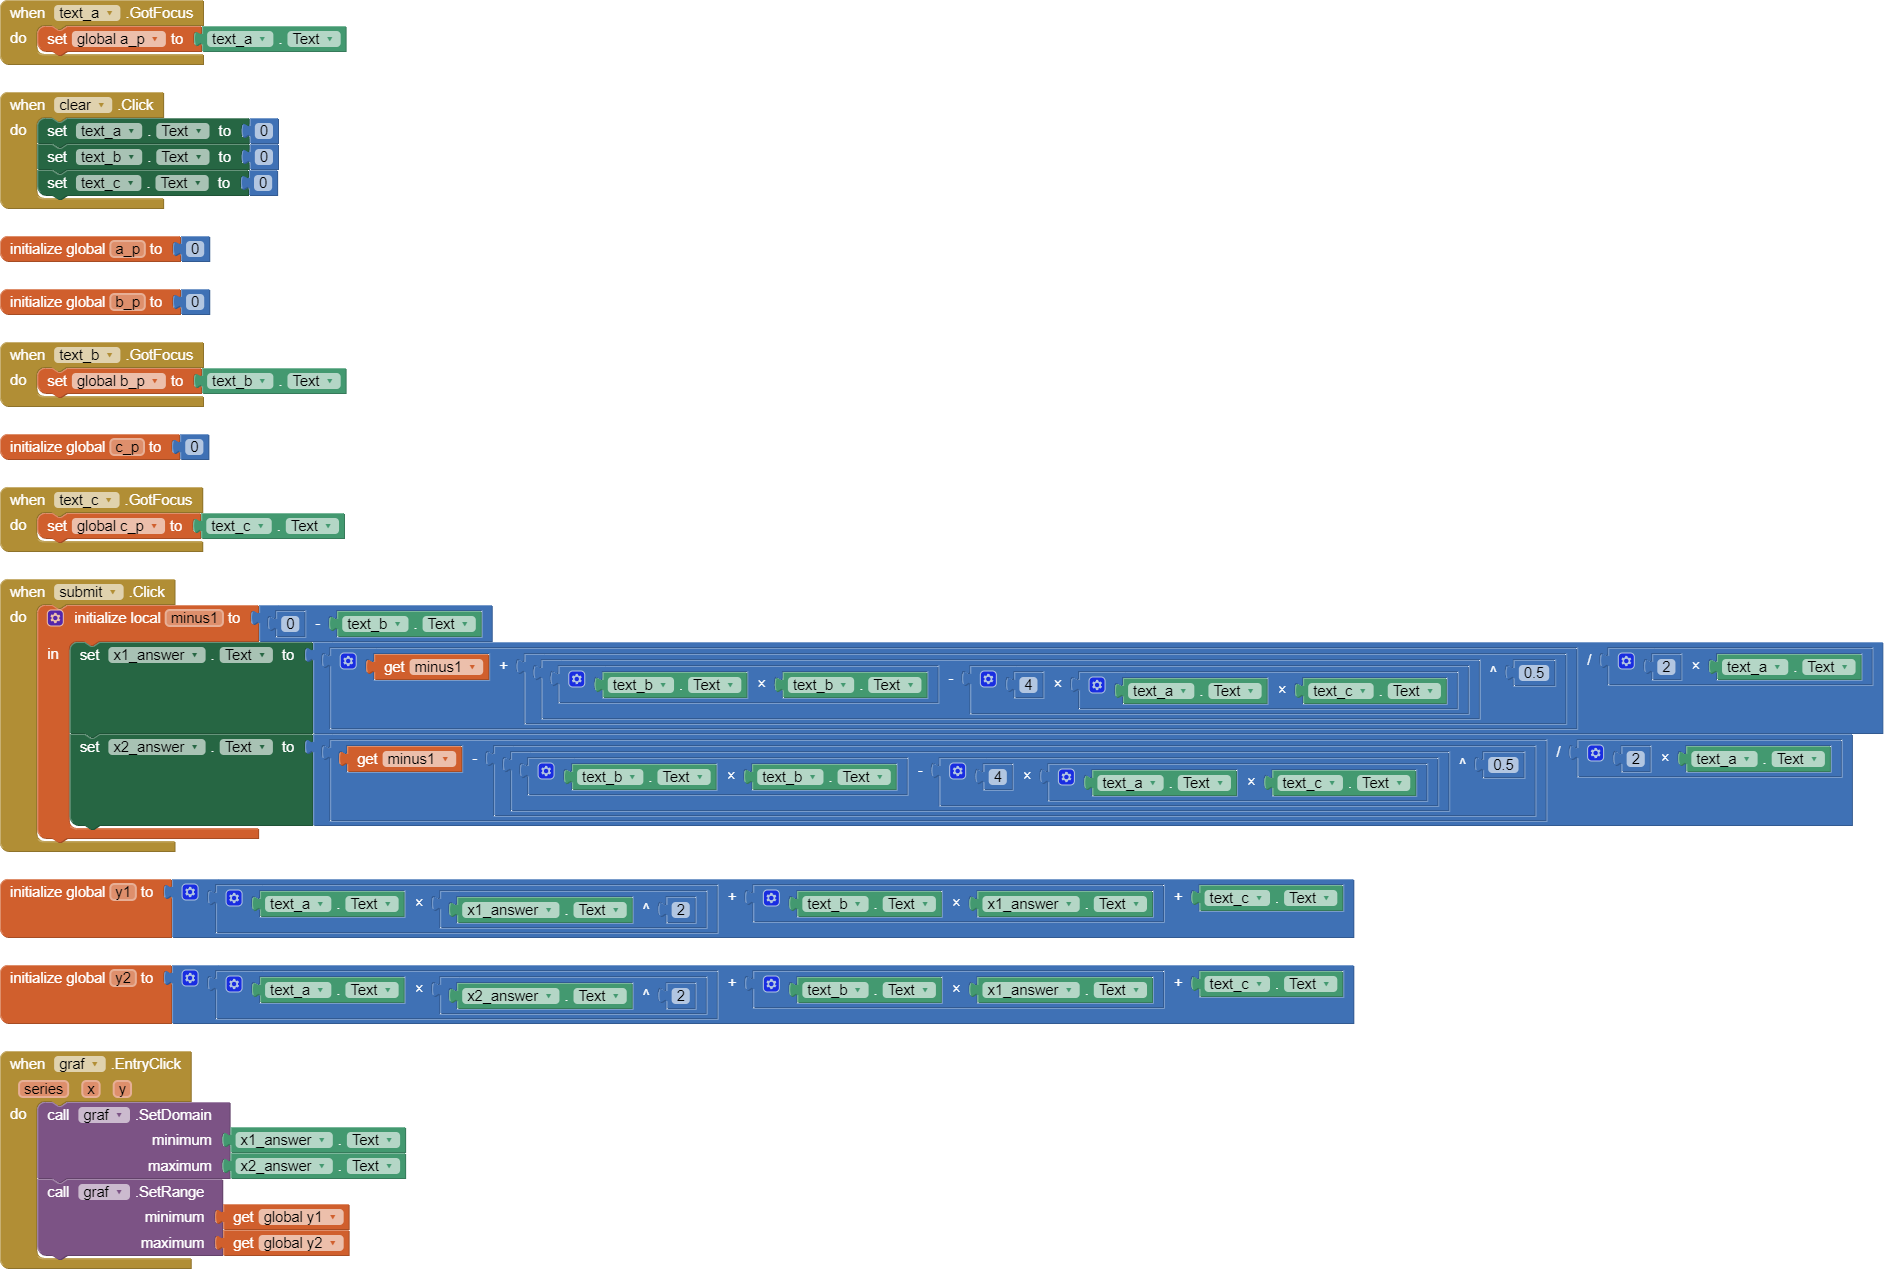
My problem is that I want to make a negative variable. I am making an app which will calculate a quadratic equation. I am sending you a screenshot of the blocks too. It always writes that it has a problem with the part where it must do -1*b_p. I am using a formula of a quadratic equation: (-b±√(b²-4ac))/(2a). I also tried to make a special variable for -1. It would be great if you help me.
Thank you in advance for your help.
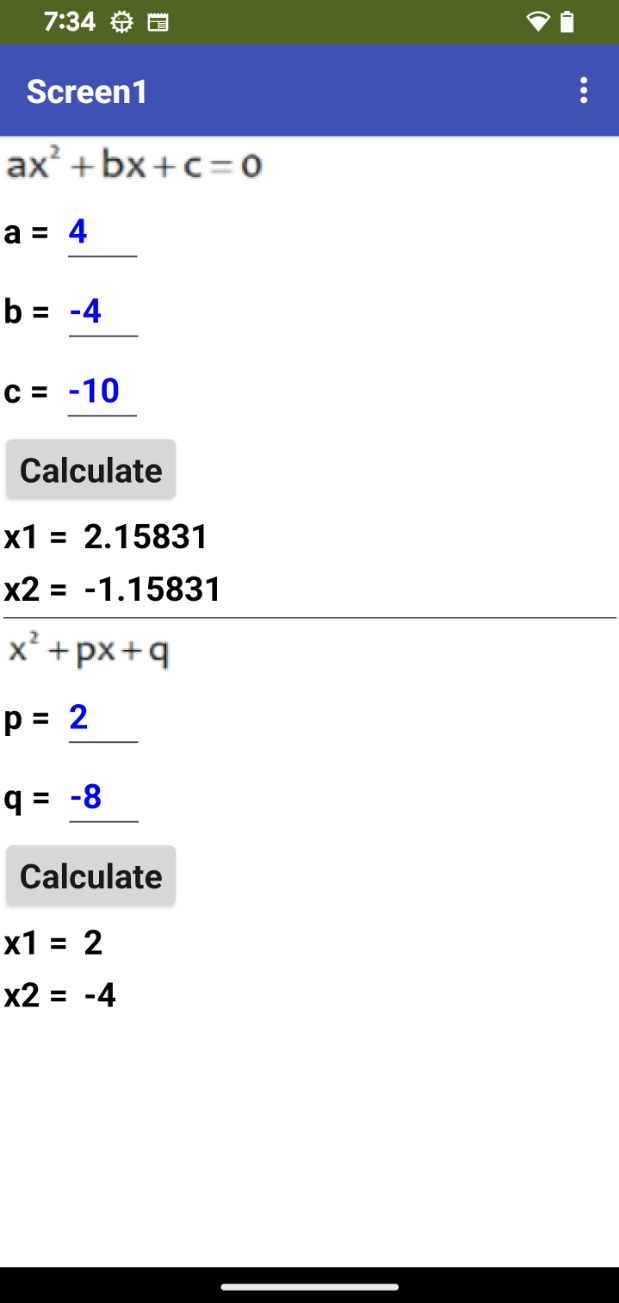
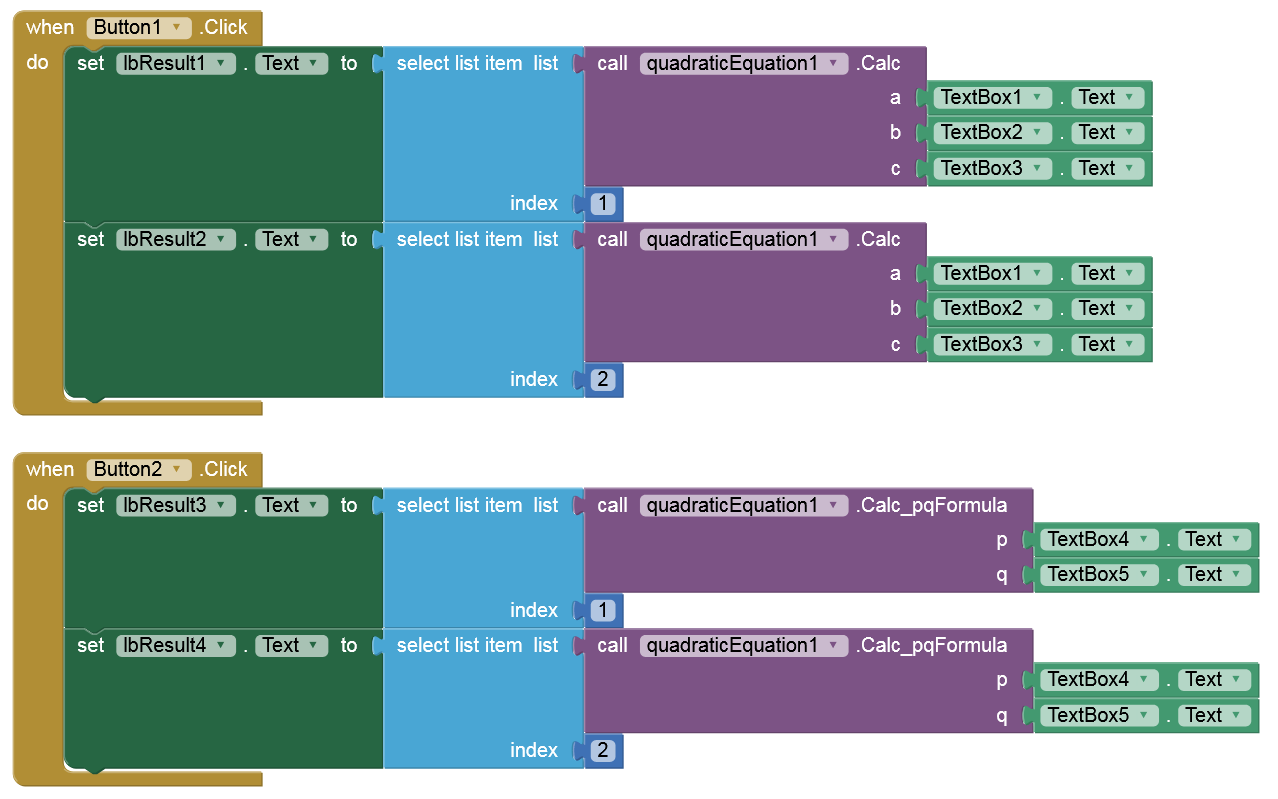
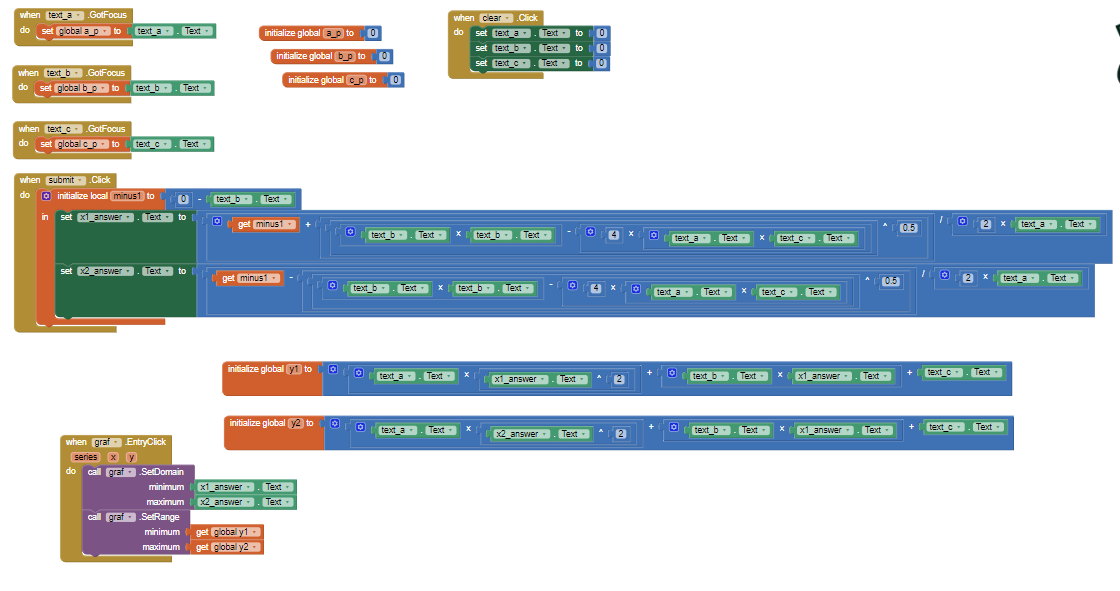
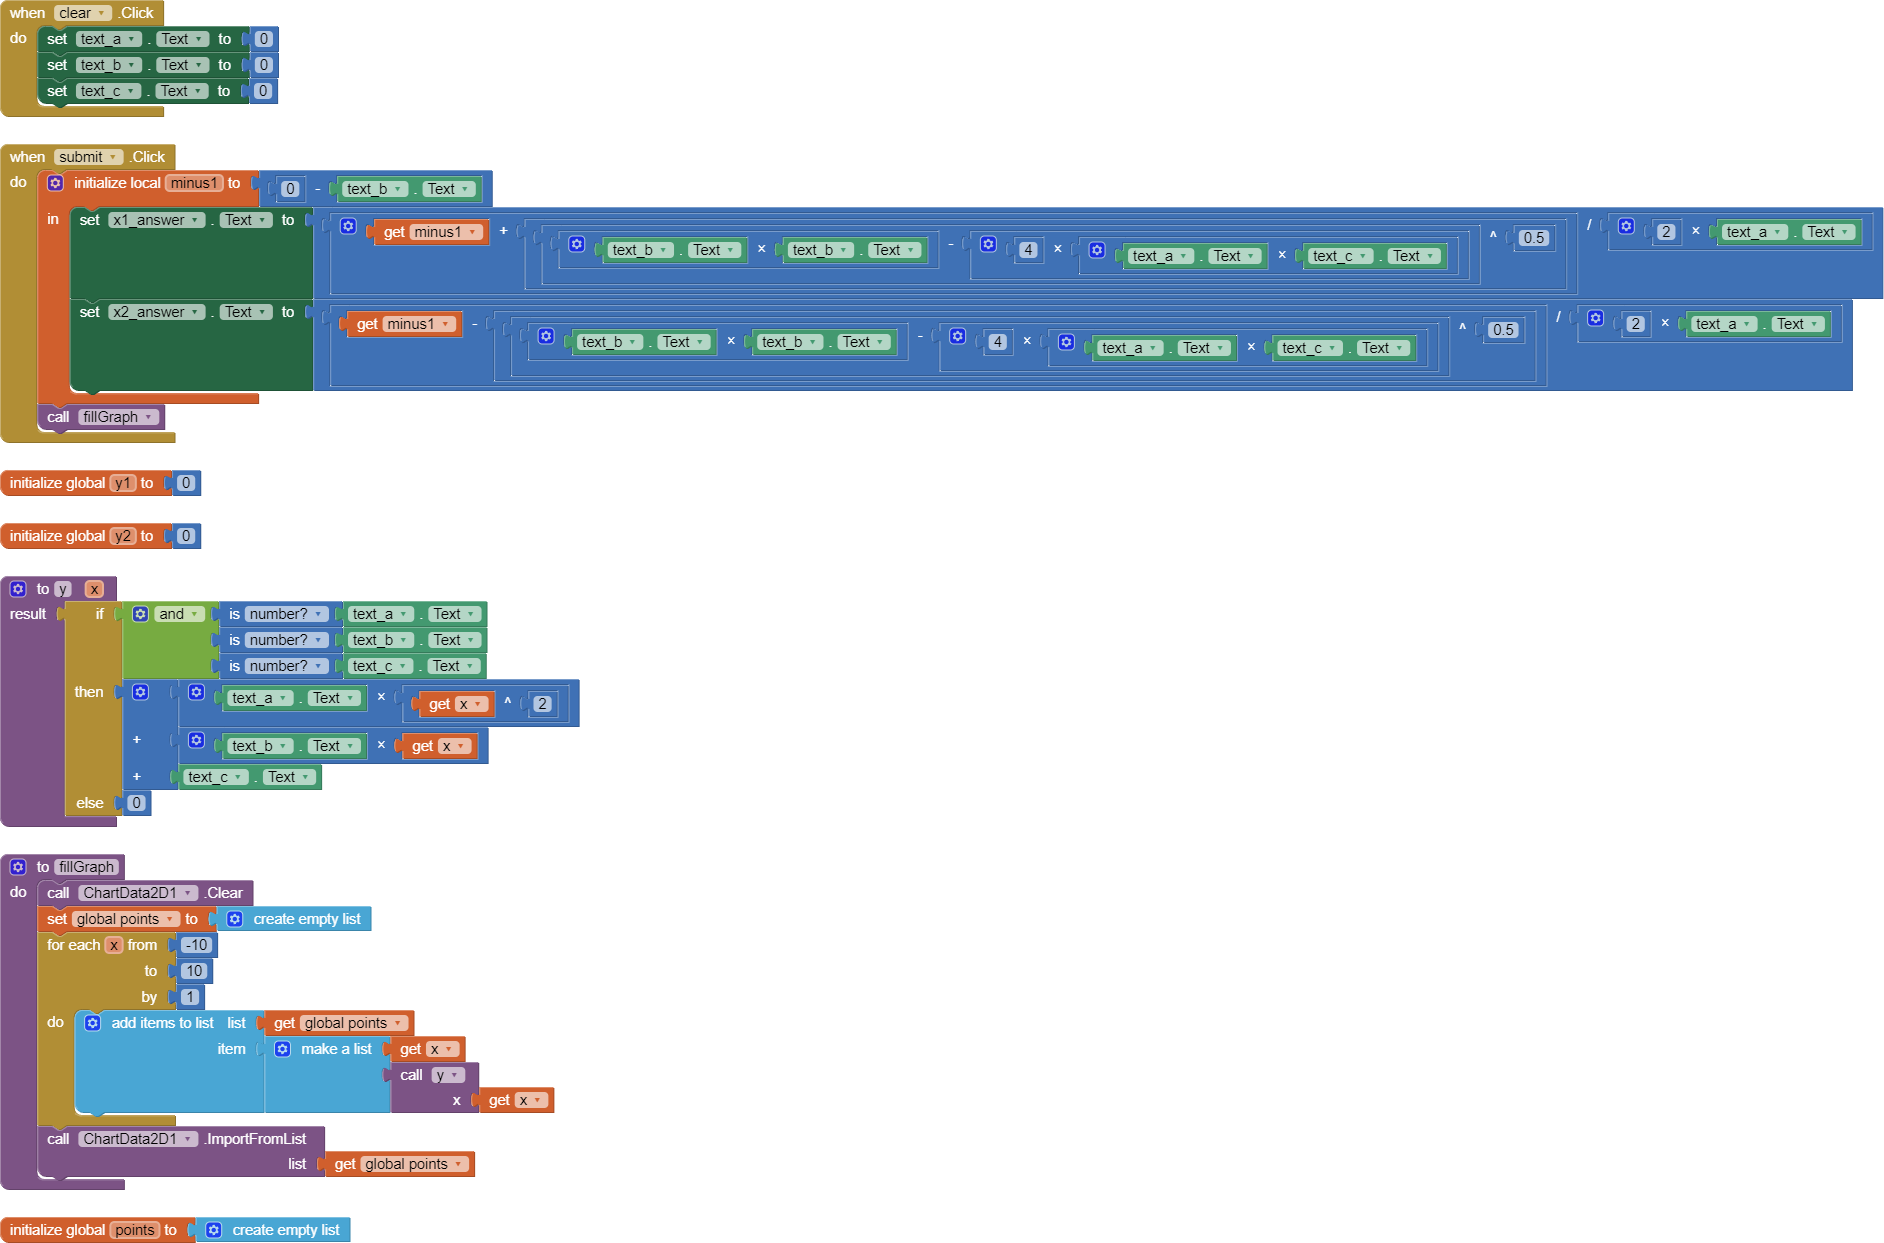
I want to ask you if you know, how to make a quadratic function graph. I changed blocks like this and now it solves a quadratic equation but I must have a graph too. It would be great if you help me.
Thank you, but I have not worked with graph in mit app inventor before and I must send it in a few days. I want to ask you, what I must change or add when I want it to work.
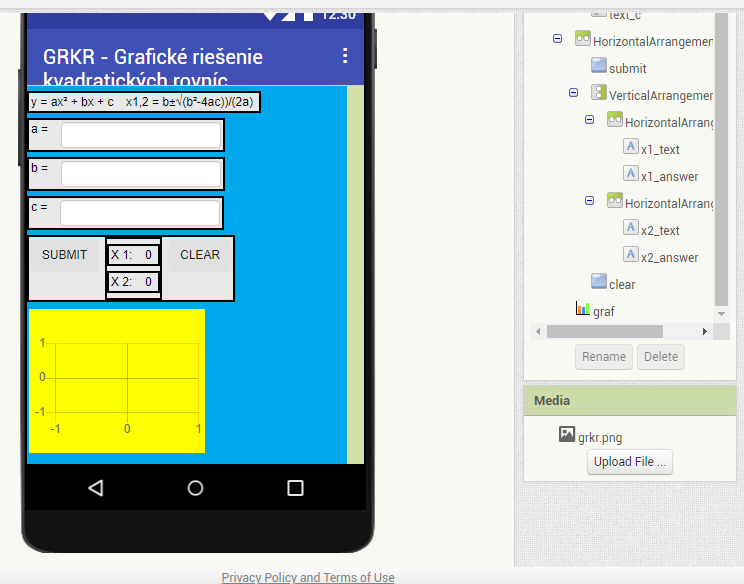
In your Designer, you added a Chart component, but you did not add the subcomponent of the Chart that is meant to hold all the (x,y) points of the chart.
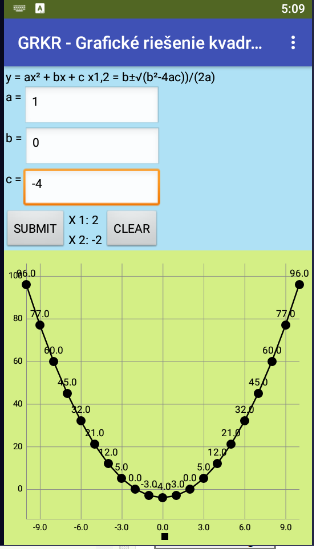
You have 3 text boxes for a,b,c (good), but you have no text boxes to enter the desired domain of x values you want to chart. That is not x1,x2 (the roots of the equation.)
You also lack a button to request plotting the chart.
You have two global init (y1 and y2) that depend on the text box values of a,b,c. However, those are always empty at startup. Just leave those 0 in the init, to be filled in later.
When you calculate values for x1 and x2 using that formula, you are solving for the roots of the quadratic equation. The roots are the places where the graph crosses the x axis (y=0), right?
So what if the graph is a parabola floating above the x axis, not touching it?
Maybe you will get imaginary numbers for x1 and x2?
No problem, AI2 can handle imaginary numbers.
The graph Entry Click event is inappropriate here, because it has no entries to click yet, lacking a ChartData2D subcomponent.