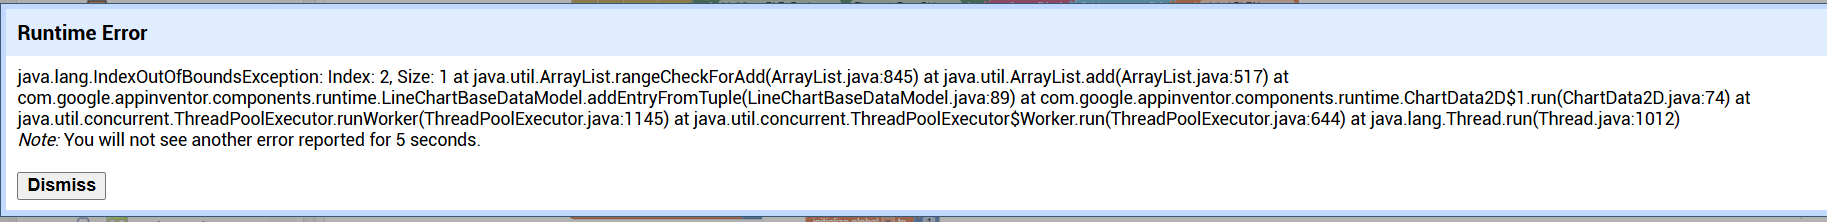
Hi so i have been trying to display pressure data and the timestamp on ChartData2D. However, i am receiving 3 different types of data. PA, PSI and KGF. I have implemented a reset button so that it will clear the Graph for the different data. So when im getting PA data , it will only display PA data and i will reset the graph and then when im getting PSI data, it will only display PSI data. but i keep getting this error
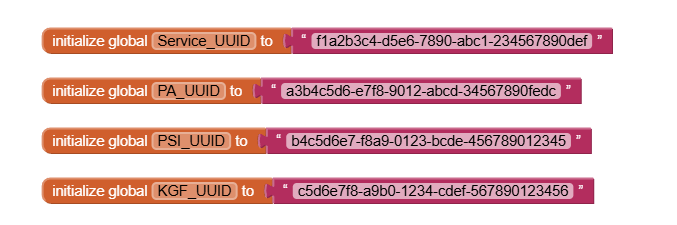
You can get more reliable conversion decision making based on the incoming characteristicUUID, since you went to the trouble of making 3 of them, right?
oh yes so basically the device that is sending the data to the app is an algometer and how it works is that the algometer can be set to three different types of units with a button. so if i press the button once , it will display Pa data and when i press it again it will display PSI data and if press one more time it will display kgf data. SendDataButton.ino (4.6 KB) ButtonForUnits.ino (4.3 KB) BLE.ino (3.8 KB)
this is the sketch code for arduino
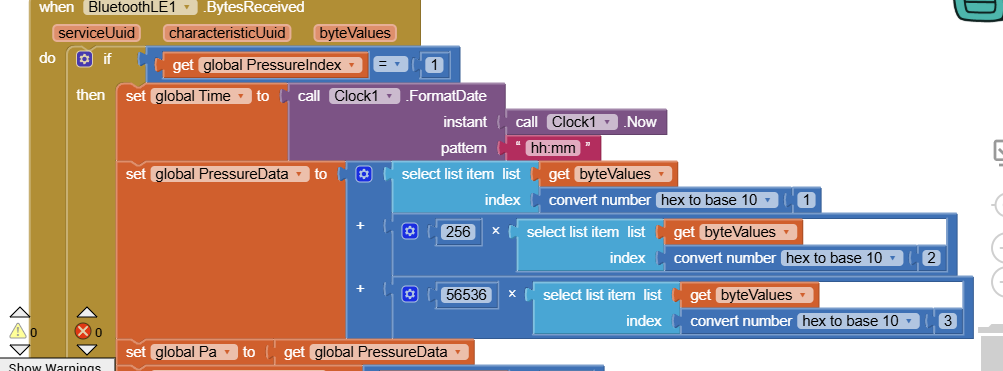
so basically the data is being transmitted as 4 bytes in little-endian format. so lets say the data being sent is 0x12345678 (hexadecimal) which is , the value being transmitted will be 0x12 0x34 0x56 0x78 (hexadecimal)
You are assuming that you will receive at least 3 bytes.
You fail to check length of list(byteValues) before attempting selects
You ignore the high end byte.
You apply a useless conversion to the list index.
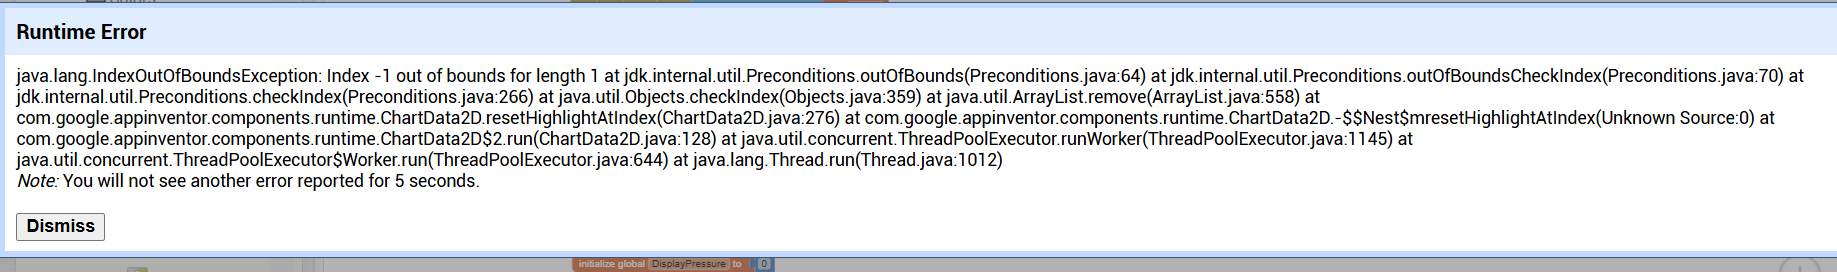
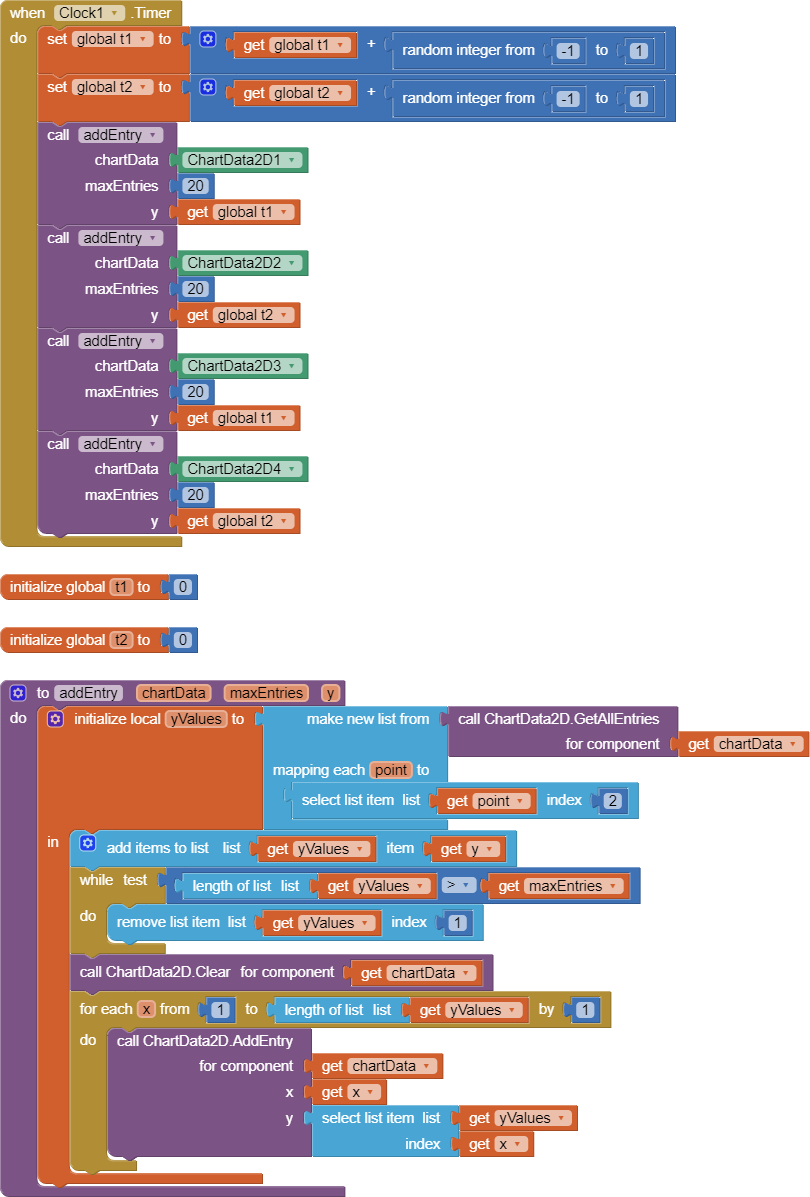
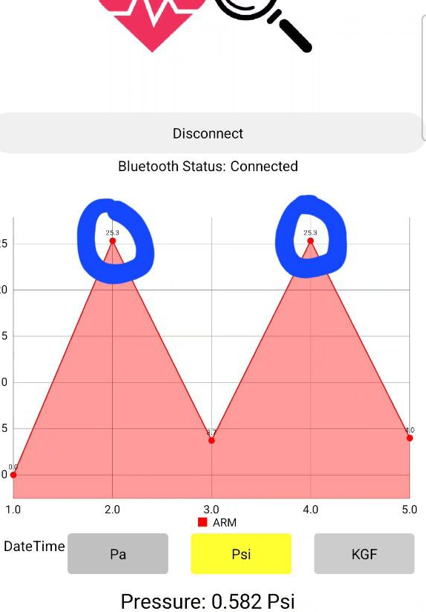
so i tried the drunkward walk method. However my reset button doesnt work. Whenever a new data of a different unit is received, a random number appears on the graph. not sure why
If you reset and more data is already in transit,
changing that global PressureIndex will put it momentarily out of sync with what's arriving, causing it to be mis-classified.
That's why I recommend removing that global variable, and using the incoming characteristic to decide how to process the incoming data.
If you decide to stick with that global variable, add an extra test to insure the characteristic matches too.