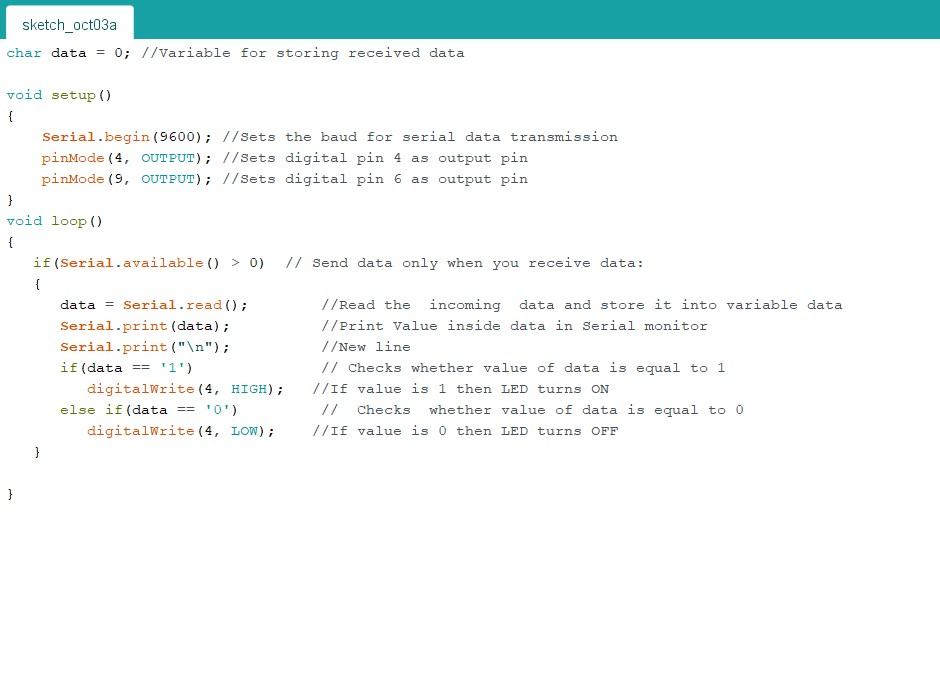
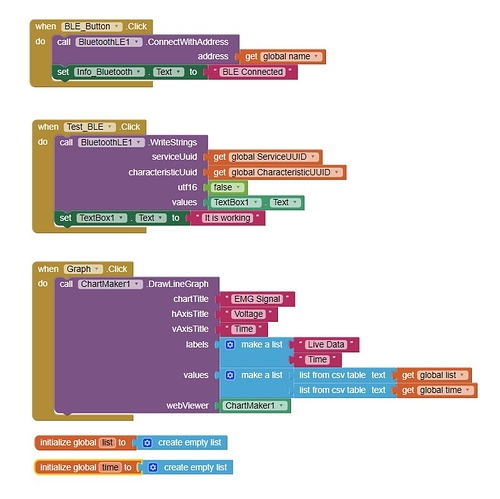
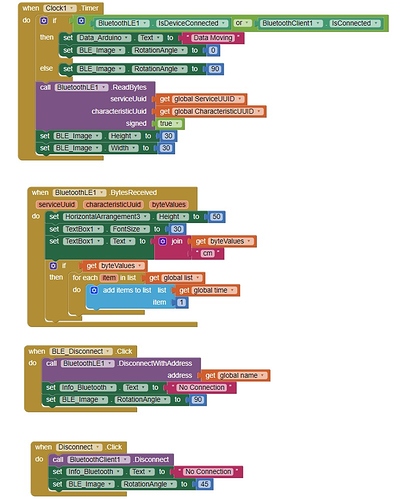
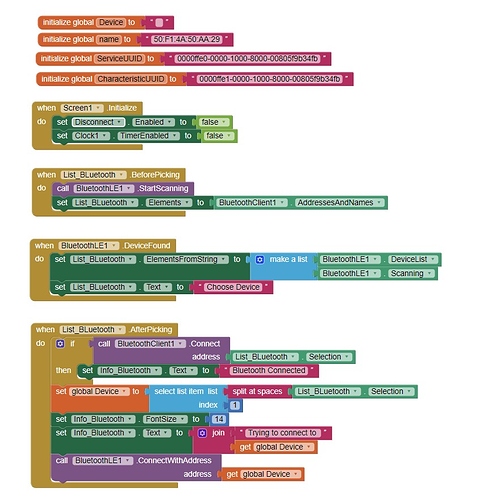
The error I get is this one:
"Argument #7 (edu.mills.appinventor.ChartMaker@55222) to 'edu.mills.appinventor.ChartMaker.DrawLineGraph(java.lang.String,java.lang.String,java.lang.String,com.google.appinventor.components.runtime.util.YailList,com.google.appinventor.components.runtime.util.YailList,com.google.appinventor.components.runtime.WebViewer)' has wrong type (edu.mills.appinventor.ChartMaker) (expected: com.google.appinventor.components.runtime.WebViewer) Note: You will not see another error reported for 5 seconds."
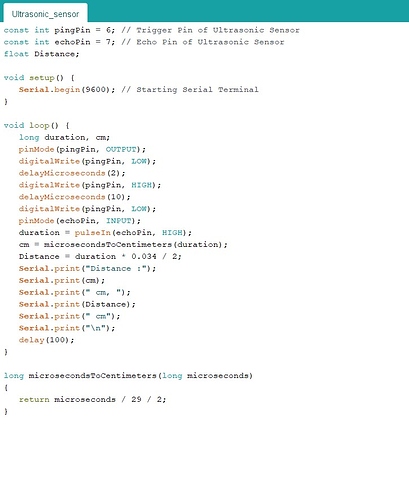
I changed the arduino code to this:
const int pingPin = 6; // Trigger Pin of Ultrasonic Sensor
const int echoPin = 7; // Echo Pin of Ultrasonic Sensor
void setup() {
Serial.begin(9600); // Starting Serial Terminal
}
void loop() {
long duration, cm;
pinMode(pingPin, OUTPUT);
digitalWrite(pingPin, LOW);
delayMicroseconds(2);
digitalWrite(pingPin, HIGH);
delayMicroseconds(10);
digitalWrite(pingPin, LOW);
pinMode(echoPin, INPUT);
duration = pulseIn(echoPin, HIGH);
cm = microsecondsToCentimeters(duration);
Serial.print(cm);
Serial.print("\n");
delay(100);
}
long microsecondsToCentimeters(long microseconds)
{
return microseconds / 29 / 2;
}
It seems to me that the problem is elsewhere... I really do not know how to proceed...
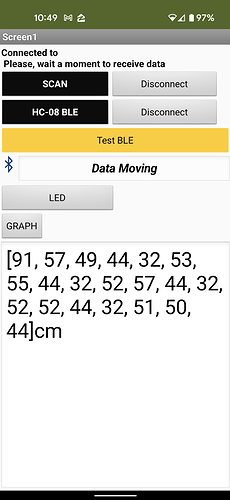
Also another thing I noticed is that the first time it writes in the box it gets [1,2,3,4,5,0,0,0,0,0,0,0,0,0,0,0,0,0,0,0,0,0] and after I click on testble I get [91,57,49,44,32,53,53,44,32,53,49,44,32,52,52,44,32,51,50,44]
I followed mostly this tutorial (https://appinventor.mit.edu/explore/blogs/karen/2016/08/heart.html) to see if I could get the data to show live as it does here. And my goals is to see a graph like this one when i click on graph (https://www.arduino.cc/en/Tutorial/Genuino101CurieBLEHeartRateMonitor)
