MIT App Inventor blank page from Google Chart

hello all, so i had been building an app to upload a csv file, display table in the app based on the data from csv file and its working fine (thanks puravidaapps!). the problem is now when i tried to display google chart (combo chart), the webviewer returns blank page. btw the reason i use google chart is bcs of the vast variation of charts.

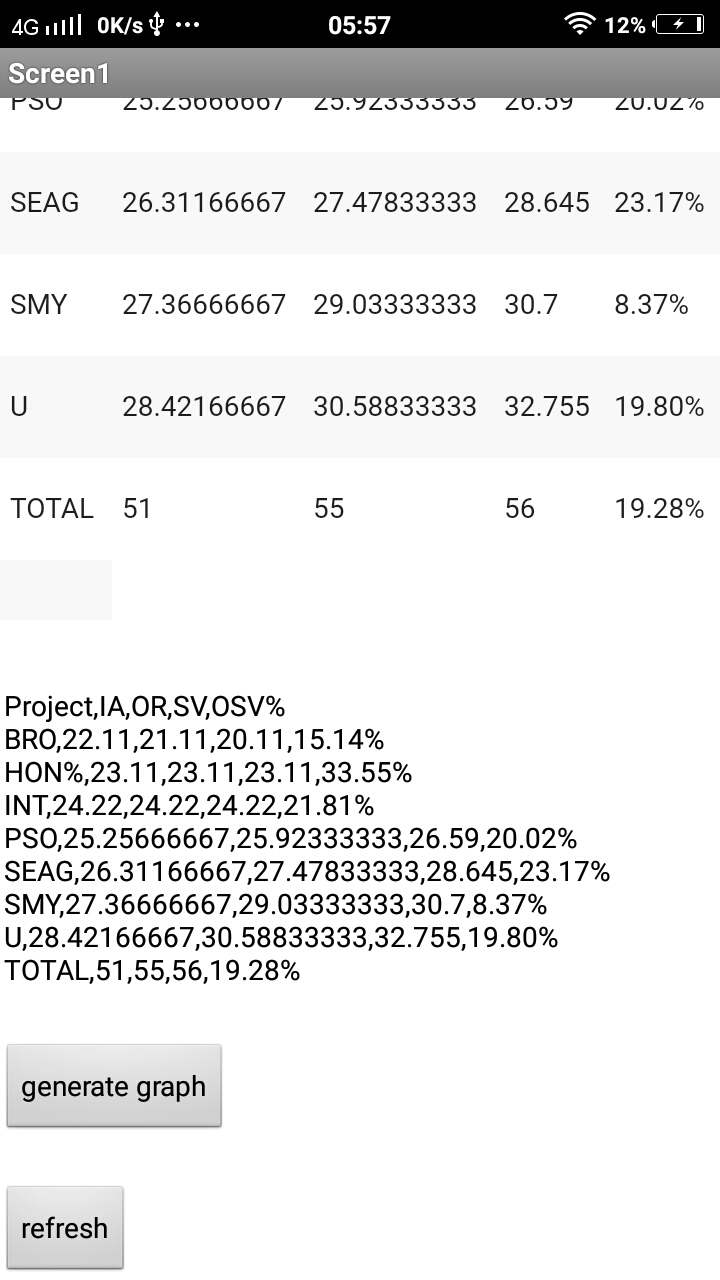
here are my input from the csv file to the webviewer ( i display it to label4 in app):

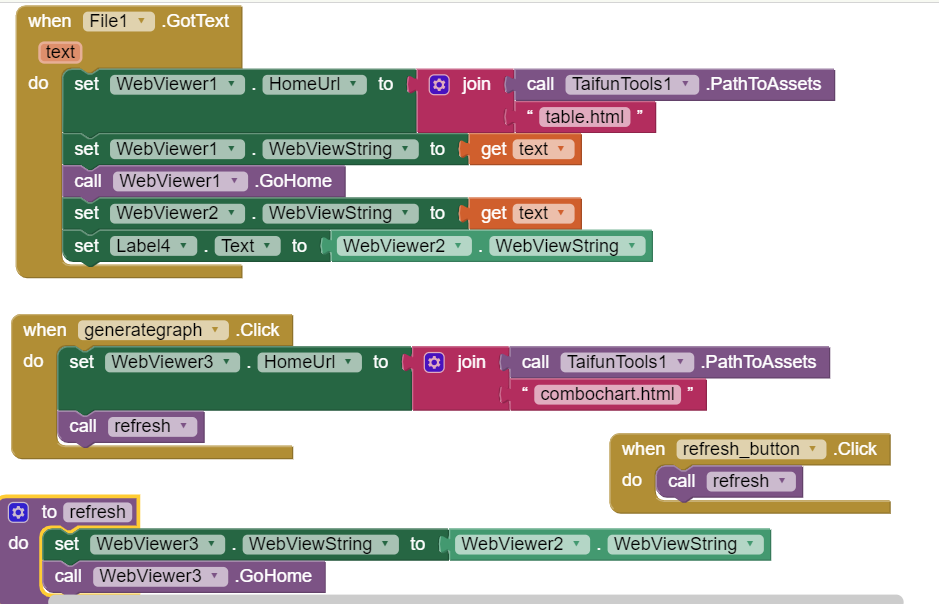
here are the relevant blocks:

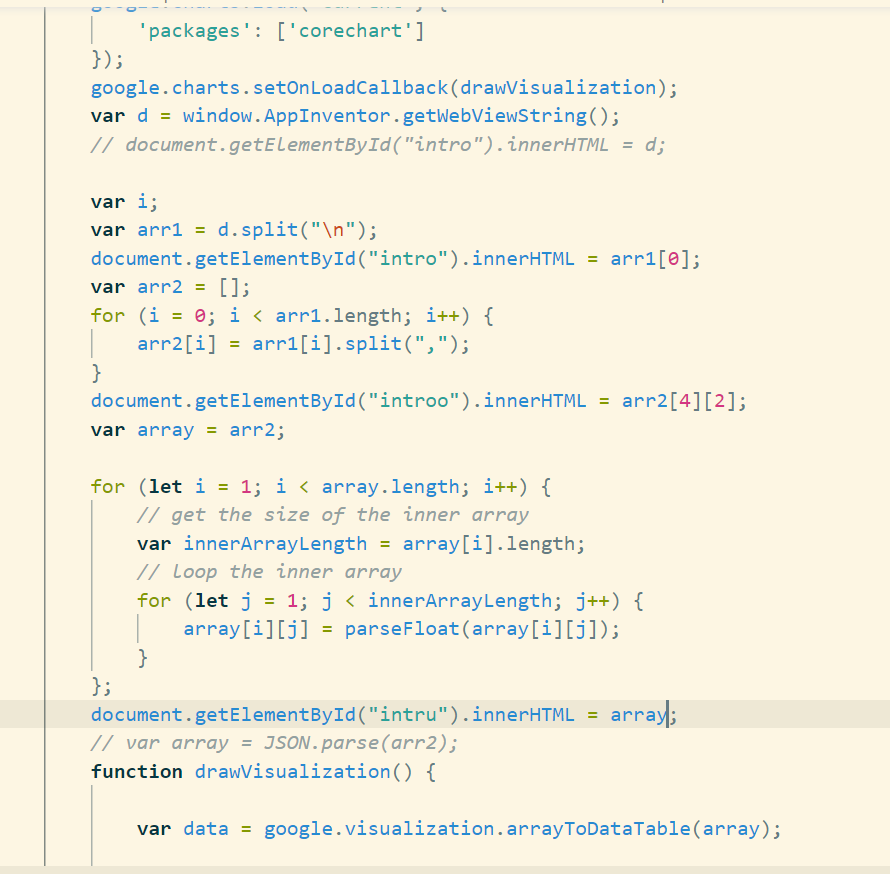
here are the html file:

and this is what i got from the getElementById from the html file(in the app):
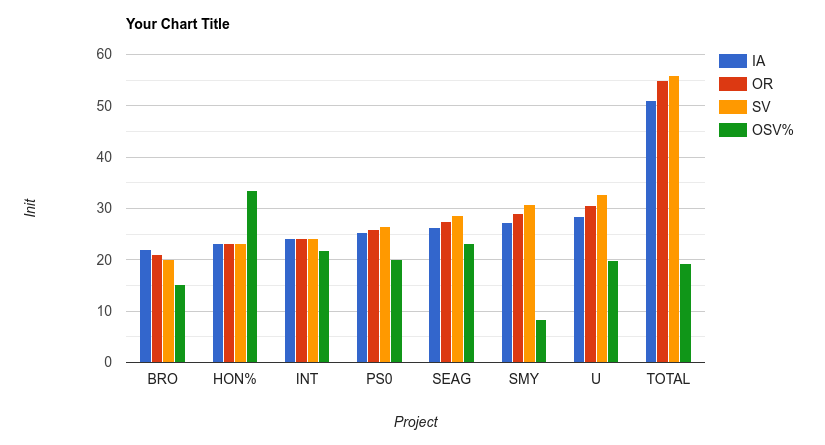
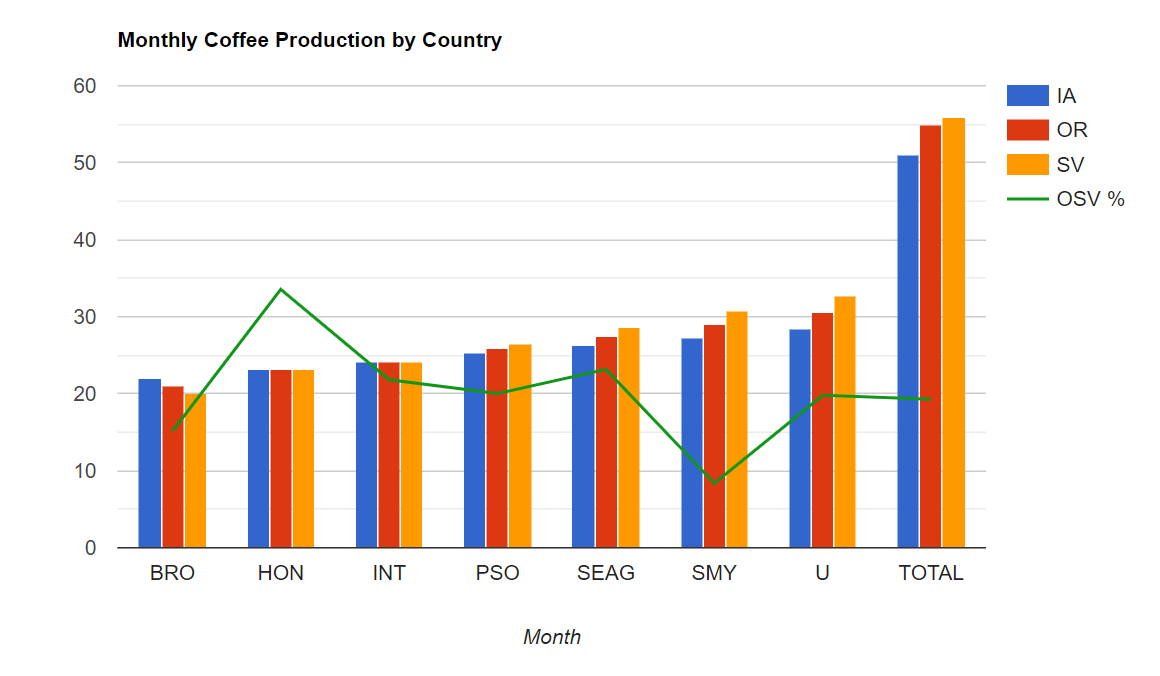
expected output:

i’m pretty sure the 2d array had been in correct format as defined by the google chart here where column 1 and row 1 should be in string and the other should in number.
i hope anyone can help because i literally have run out of idea anymore on how to fix this. Thank you!

This is not really an App Inventor question, however, it is the transfer and formatting of the table data that is causing you problems.

Here is the html needed to display your data:
(I have tidied up the long decimals, and removed the % signs in order to display, also had to change BR* as this is not an allowed word on the forum!)

<html>
  <head>
    <script type="text/javascript" src="https://www.gstatic.com/charts/loader.js"></script>
    <script type="text/javascript">
      google.charts.load('current', {'packages':['corechart']});
      google.charts.setOnLoadCallback(drawVisualization);

      function drawVisualization() {
        var data = google.visualization.arrayToDataTable([
			['Project',	'IA',	'OR',	'SV',	'OSV%'],
			['BRU',		22.11,	21.11,	20.11,	15.14],
			['HON%',	23.11,	23.11,	23.11,	33.55],
			['INT',		24.22,	24.22,	24.22,	21.81],
			['PS0',		25.26,	25.92,	26.59,	20.02],
			['SEAG', 	26.31,	27.48,	28.65,	23.17],
			['SMY',		27.37,	29.03,	30.70,	8.37],
			['U',		28.42,	30.58,	32.76,	19.80], 
			['TOTAL',	51,		55,		56,		19.28]
			]);

        var options = {
          title : 'Your Chart Title',
          vAxis: {title: 'Init'},
          hAxis: {title: 'Project'},
          seriesType: 'bars',
          };

        var chart = new google.visualization.ComboChart(document.getElementById('chart_div'));
        chart.draw(data, options);
      }
    </script>
  </head>
  <body>
    <div id="chart_div" style="width: 900px; height: 500px;"></div>
  </body>
</html>

You will need to do work on the table data to get it into the format required by gviz