That means the graph has 'fake' data I guess.
Perhaps. You could make a simple Bar graph that shows RSSI strength versus distance.
What you do depends on what your data stream from your esp32 looks like and what you are doing with it and how you calculate distance. If you have all that solvedconsider using a ChartMaker solution using the free extension at GitHub - MillsCS215AppInventorProj/chartmaker: An extension for MIT App Inventor that adds graphing capability (for pie, bar, and line graphs) through Google Charts. · GitHub. I don't have any experience with HighCharts.
To graph your data with ChartMaker, the data needs to be in the form of a List of Lists . The the first value is distance and the second is the RSSI value (for example 432 meters and an RSSI of 80).
["432,80", "620,89", "962,77", "1395,4", "1825,78", "2282,79", "2871,30", "3427,72", "4009,15", "4558,9", "5167,51", "5771,18", "6412,22"]
Do you have your data like that? If so, you can make a graph something like
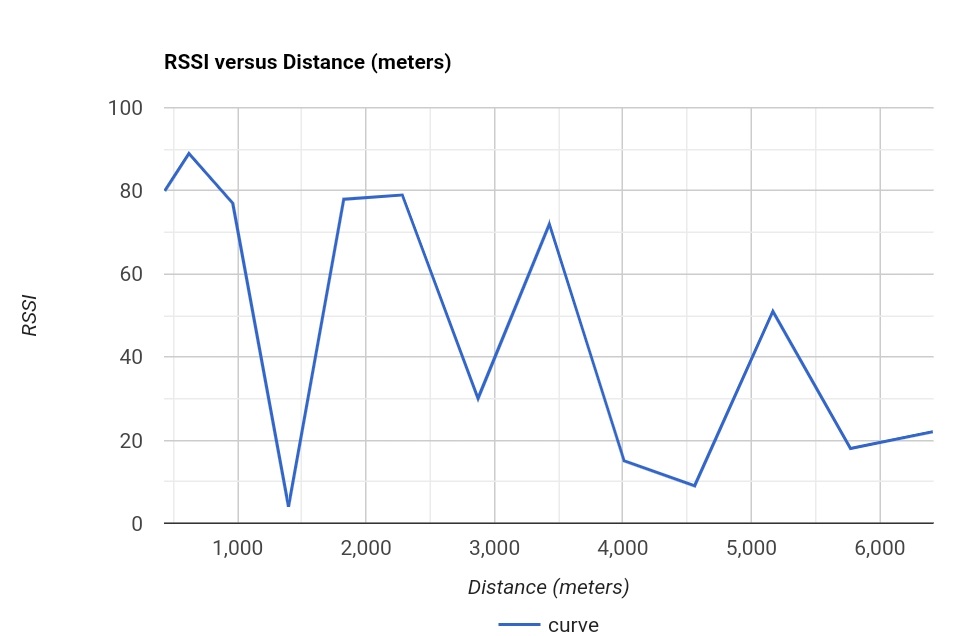
You should be able to update the Chart with a Button or Clock event handler, depending on how you capture your data. This discussion might help you figure out what you want to do Chart Maker help please - #6 by Sirous_Nekooei