I have managed to plot several markers on the map, lets imagine delivery locations, say 8 of them so 8 markers but the delivery locations will change daily, some days they could all be within the same city 10 mile radius, some days they could be spread over 150 miles between the furthest locations.
Is there a way for me to pan / zoom when the map opens to display the whole cluster so that the cluster of markers fits the extent of the may window and able to adjust itself automatically to a different cluster each day rather than starting with a canvas of hundreds of square miles and a 5 mile radius cluster off screen ?
Im aware it can be done for one marker but I havent found a way to do it for a cluster yet.
When you have set all your map markers, draw (it can be invisible) a polygon using all the map marker coordinates. You should then be able to get the centroid of the polygon, and use this to centre your map...(not tested)
Example can be found here for creating a polygon
Probably can use
BoundingBox
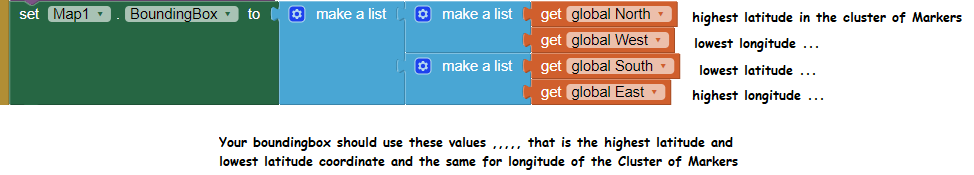
Sets or gets the current boundary for the map’s drawn view. The value is a list of lists containing the northwest and southeast coordinates of the current view in the form ((North West) (South East)).
and a list of the coordinates of each of the markers.
Figure out the Westernmost longitude, Easternmost longitude, Northernmost latitude, Southernmost latitude in each cluster and set the BoundingBox coordinates using the resulting northwest and southeast coordinates. ![]()
1 Like
SteveJG
I've been trying your suggestion of using BoundingBox.
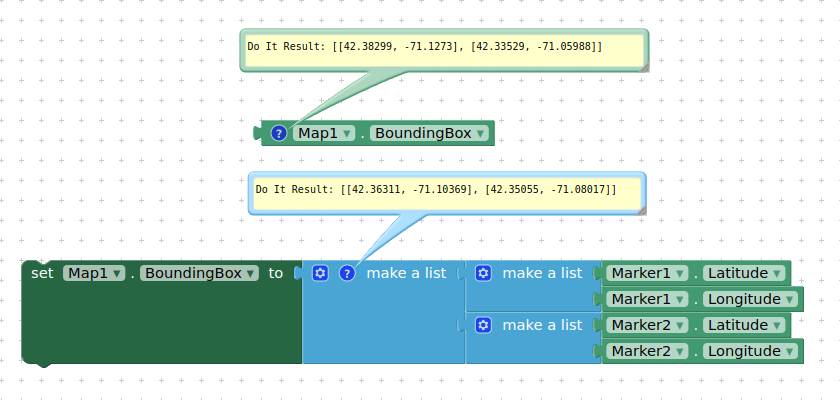
I made a list of 2 coordinates to try and set the BoundingBox but it fails with runtime error - "java.lang.String cannot be cast to com.google.appinventor.components.runtime.util.YailList"
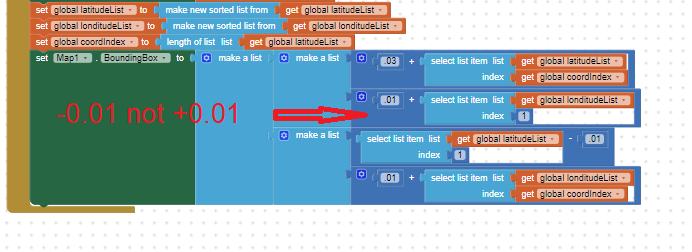
Using the blocks below to compare the figures.
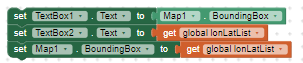
textbox1 shows [[57.5976, -2.70631],[57.09971, -2.177155]]
textbox2 shows ["57.6858814 -2.0134259",57.2964716 -2.1426393"]
are the coordinates needing to be just to 4 decimal places and why does my list appear as a list of strings ?
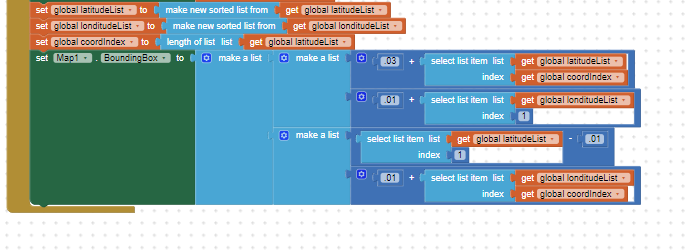
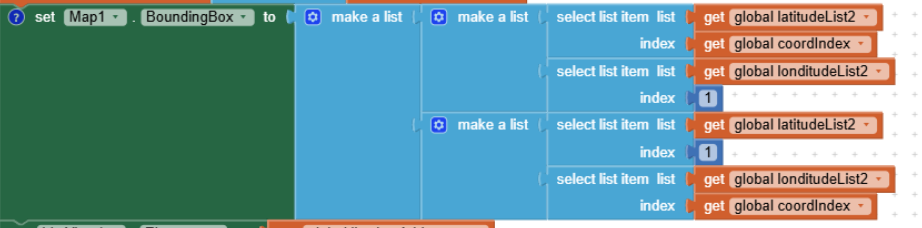
BoundingBox looked the easiest of the two options and it was .. sorting out the Tinydb sotorint a dictionary and trying to re-order the lists was a nightmare but I got there eventually.
Sorting the values was easy enough and I added a bit of padding to prevent the markers being too close to the edge of the map plot area.
It looks fine but ill need to try on the go to see how it performs in use.
I have some questions about markers but Ill ask those in a separate question so its searchable on the subject matter.
Thanks
Steve
Thats because you are making the same mistake that I did when I added the padding ![]() ....
....
Why do you suggest that I should subtract Padding value from West not add ?
I added the padding and it looked ok in the sample quantities of locations used but during open testing markers still appeared to be almost off the map and the "padding" made no difference at all on the majority of locations.
I had too narrow a view of the issue.
What was really controlling where the markers appeared was the map tiles / zoom.
The zoom level was calculated by the spread of the markers, without intermediate zoom levels the nearest zoom level was used, sometimes markers were only just on the map and others much more centrally located.
I also live on the East Coast of the UK which I believe also loaded the the zoom / tiles one way or the other. Areas of the map over oceans and unpopulated areas will have less detail of interest which also has an impact on zoom levels.
In short the zoom level was too unpredictable to be able to compensate for it by using the padding, even when trying to scale the padding to the zoom levels rather than fixed size padding.
A marker 1 mile one way or the other could make the map jump to the next zoom level, the padding was pointless.
This is what went live in the app.
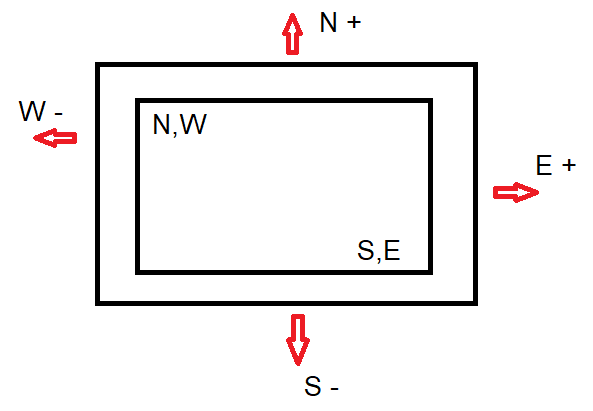
the outer rectangle represents enlarged map boundary using padding so for west you should subtract
1 Like
Yes in theory but in practice I found the zoom level dictated the aesthetic of the map. The padding was immaterial.
I'm many cases if a marker was too close to the edge of the map the padding caused the map to jump to the next zoom level, leaving a cluster of markers in the center of the map that you needed to then zoom in on.
The positive padding has been added through adapting to the results on the map not logic.
In your case, I suggest calculating the centroid of the specified points and then panning the map to center on the centroid at a zoom level that aligns with your requirements. You might find it beneficial to experiment with different zoom levels, particularly between 12 and 14, as these levels often provide optimal visualization for locations in the UK.
Furthermore, I have attached a text file that details the procedure for calculating the centroid, which was generated by ChatGPT.
centroid.txt (3.2 KB)
No need, it works perfectly well as it is.
This topic was automatically closed 7 days after the last reply. New replies are no longer allowed.