Hi! I'm using the ChartMakerPlus to create a graph-analyzing app.
Topic for my app:
Hypertension data recording
Briefing about my plan:
- Users can type the systolic and diastolic data in textboxes
- The data will saved once the "SAVE" button is clicked
- The recorded data will be analyzed in multiple line graph
The problem that I am facing:
- The lines are not present although data is saved
- Runtime error (refer the picture below)

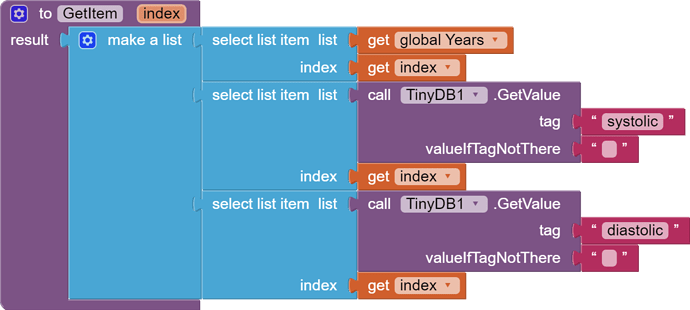
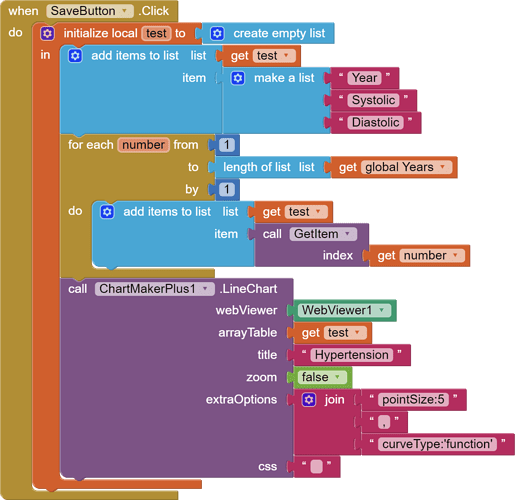
Here is the png of block for my app:

Can someone help me to check what's wrong with my block please? Greatly thanks!

