Good afternoon.
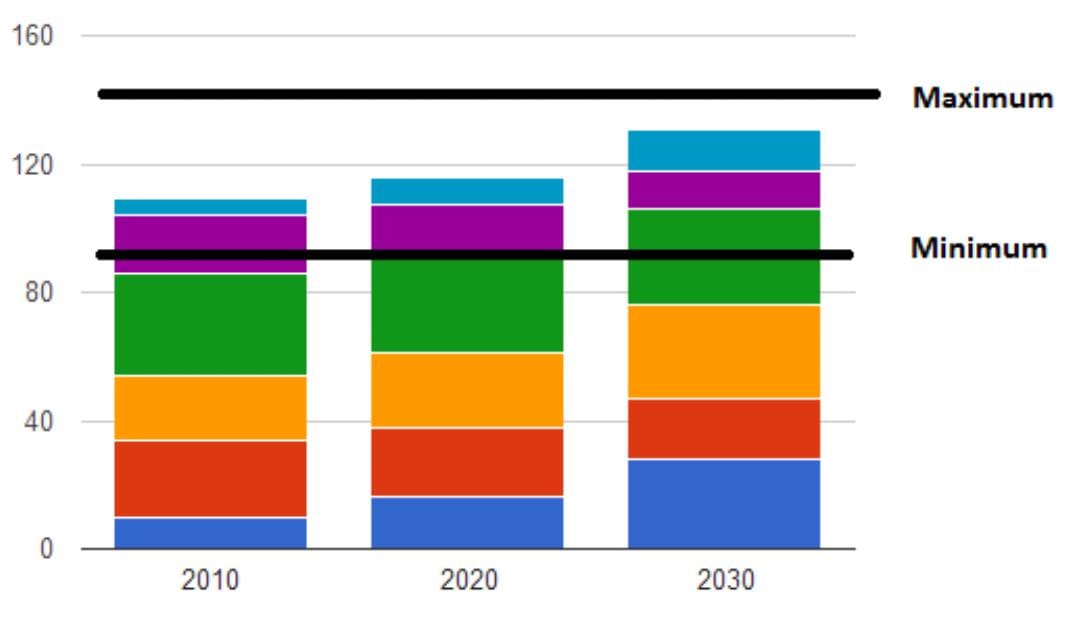
I am the user of column_chart ChartMakerPlus and i have a problem, how to make a stacked column chart get an target in a line shape like in combo chart ? thanks
Can you show an image example of what you mean?
i'm sorry i mean stacked not stucked, i've seen your posting about combo chart and it's awesome. Now, i want to make combo chart but the column in stacked shape. thanks
You should be able to make a stacked column chart using the IsStacked:true option, with columnChart,
but there is no provision for a combo chart in the extension, you would need to build a complete combo chart using google charts for that.
i've done to make Stacked Column chart , but i need a line as an target. can you make a local host which contain stacked column with a line as an target like your previous posting?
combo.html.txt (1.4 KB)
This
HTML
<html>
<head>
<script type="text/javascript" src="https://www.gstatic.com/charts/loader.js"></script>
<script type="text/javascript">
google.charts.load('current', {'packages':['corechart']});
google.charts.setOnLoadCallback(drawVisualization);
function drawVisualization() {
// Some raw data (not necessarily accurate)
var data = google.visualization.arrayToDataTable([
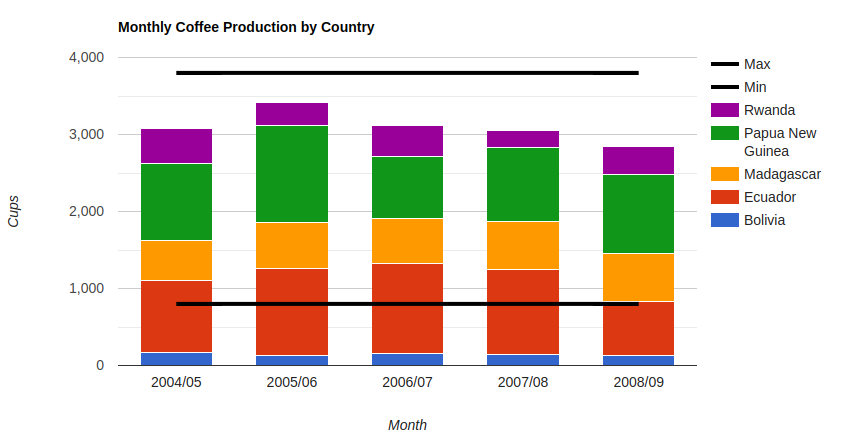
['Month', 'Bolivia', 'Ecuador', 'Madagascar', 'Papua New Guinea', 'Rwanda', 'Min', 'Max'],
['2004/05', 165, 938, 522, 998, 450, 800, 3800],
['2005/06', 135, 1120, 599, 1268, 288, 800, 3800],
['2006/07', 157, 1167, 587, 807, 397, 800, 3800],
['2007/08', 139, 1110, 615, 968, 215, 800, 3800],
['2008/09', 136, 691, 629, 1026, 366, 800, 3800]
]);
var options = {
title : 'Monthly Coffee Production by Country',
vAxis: {title: 'Cups'},
hAxis: {title: 'Month'},
seriesType: 'bars',
isStacked: true,
series: {
5: {type: 'line',color: 'black',lineWidth: 4},
6: {type: 'line',color: 'black',lineWidth: 4}
},
};
var chart = new google.visualization.ComboChart(document.getElementById('chart_div'));
chart.draw(data, options);
}
</script>
</head>
<body>
<div id="chart_div" style="width: 900px; height: 500px;"></div>
</body>
</html>
Makes this:
1 Like
Thanks a lot for your help, now i'll try to make this script in local host appinventor.
sorry i ask again, can you show me the step or video link tutorial to insert script like combo.html.txt in local host from your combo chart.aia?Add numbers from the list to ChartMakerPlus - #13 by TIMAI2
because i got a little confuse, thanks
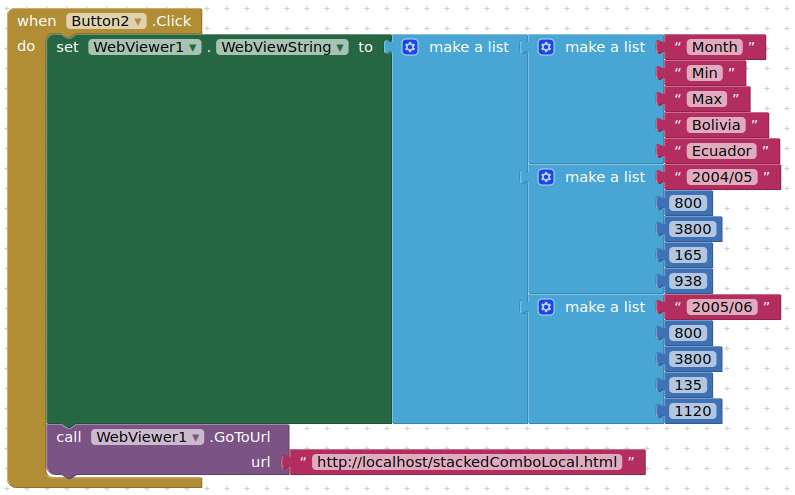
I only used some of the data....
I moved the Min and Max columns to 0 and 1, so they will always be therre, regardless of the columns you add
<html>
  <head>
    <script type="text/javascript" src="https://www.gstatic.com/charts/loader.js"></script>
    <script type="text/javascript">
      google.charts.load('current', {'packages':['corechart']});
      google.charts.setOnLoadCallback(drawVisualization);

      var wvs = JSON.parse(window.AppInventor.getWebViewString());

      function drawVisualization() {

        var data = google.visualization.arrayToDataTable(wvs);

        var options = {
          title : 'Monthly Coffee Production by Country',
          vAxis: {title: 'Cups'},
          hAxis: {title: 'Month'},
          seriesType: 'bars',
          isStacked: true,
          series: {
			  0: {type: 'line',color: 'black',lineWidth: 4},
			  1: {type: 'line',color: 'black',lineWidth: 4}
			  },
        };

        var chart = new google.visualization.ComboChart(document.getElementById('chart_div'));
        chart.draw(data, options);
      }
    </script>
  </head>
  <body>
    <div id="chart_div" style="width: 100%; height: 100%;"></div>
  </body>
</html>

I'm very grateful for this example. but i mean, how to insert your script stackedComboLocal.html in your local host? because when i try to set url above i got message "404 not found". in this case i make my app using MIT app inventor online not offlne,
if i know how to insert script.html in url like that in MIT app inventor online , so i can explore to make own script. i need your help for the step or tutorial.
thanks.
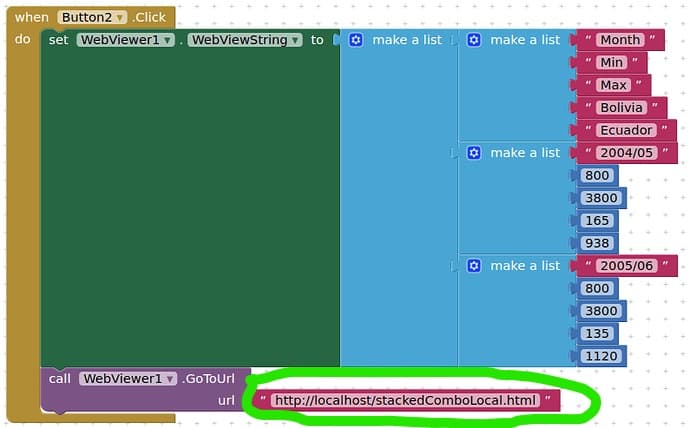
this localhost means assets, you need to upload the html to asset.
Can you show me the step how to upload the html to asset? in this case i'm using app inventor online not offline.
Thanks
designer view, media, upload file.
1 Like
great, it's work. Thanks for your help
This topic was automatically closed 7 days after the last reply. New replies are no longer allowed.