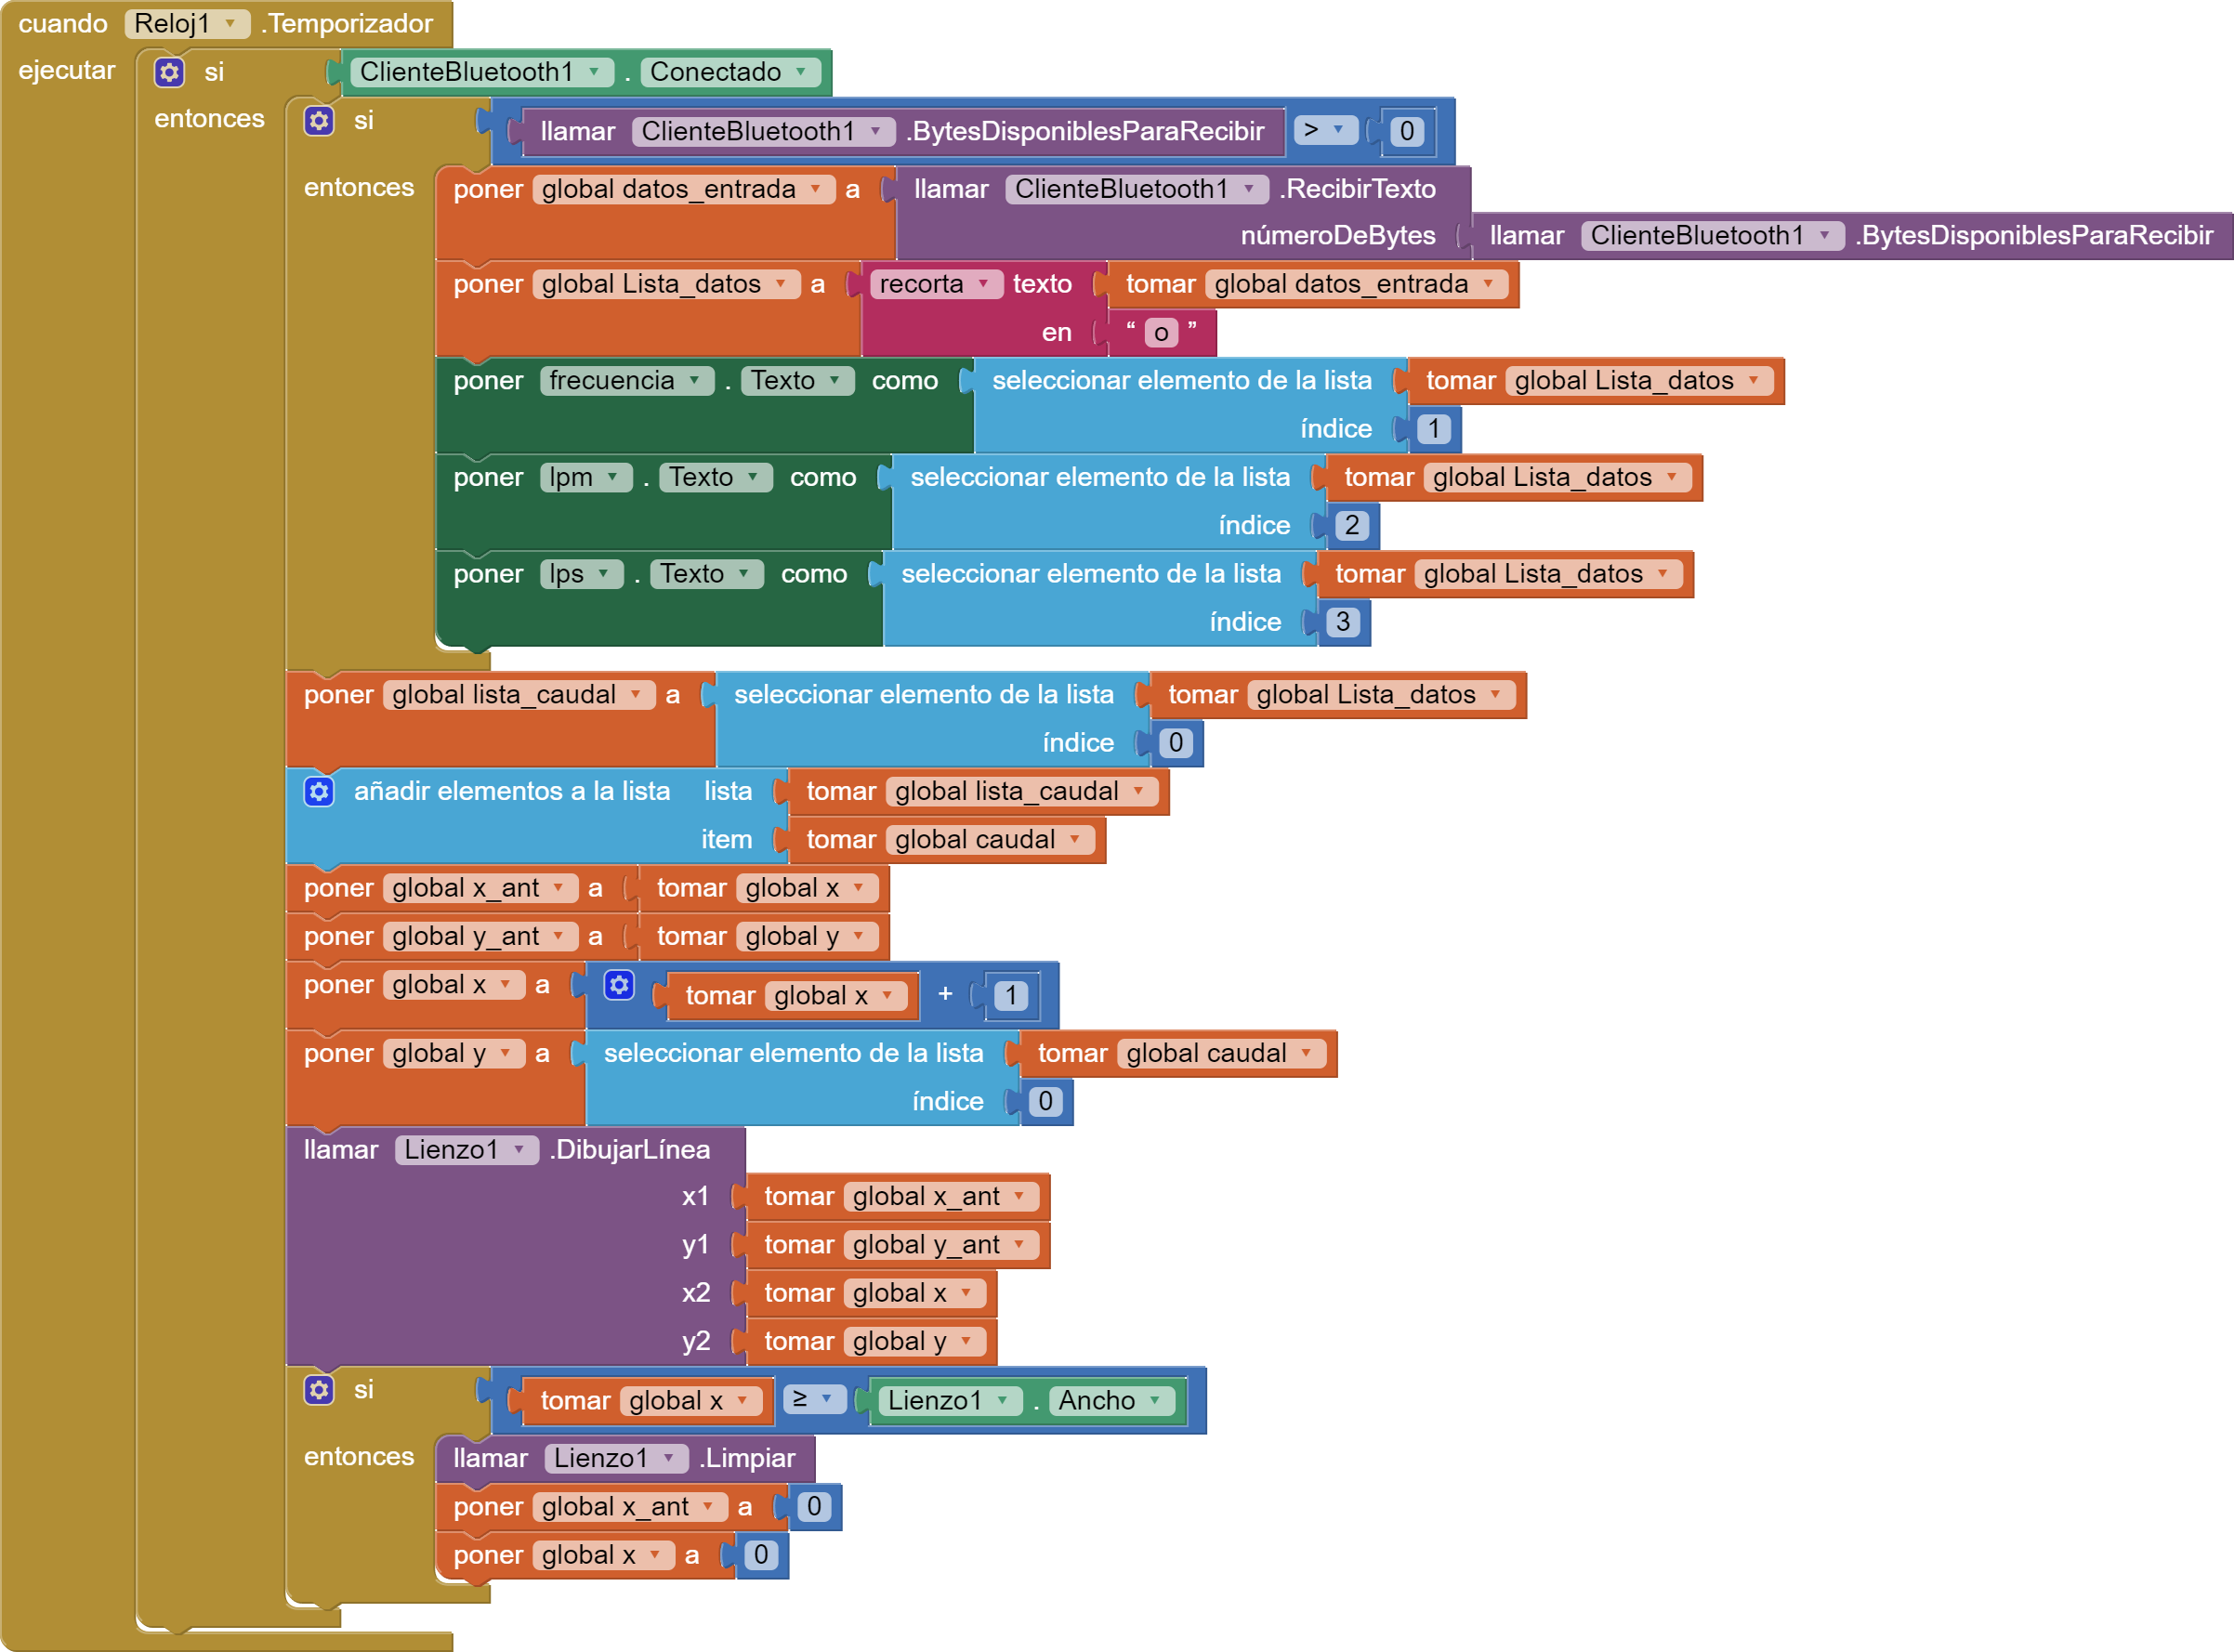
Hello, sorry, I'm very new and I want to have app inventor create a graph for me with the 3 variables that you see there, I made this block system but it doesn't work for me, I know it's wrong but I don't know how to do it, sorry for the English of Google xdde
Be sure to use println() at the end of each message to send from the sending device, to signal end of message.
Only use print() in the middle of a message.
Be sure not to println() in the middle of a message, or you will break it into two short messages and mess up the item count after you split the message in AI2.
Do not rely on timing for this, which is unreliable.
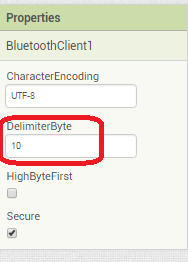
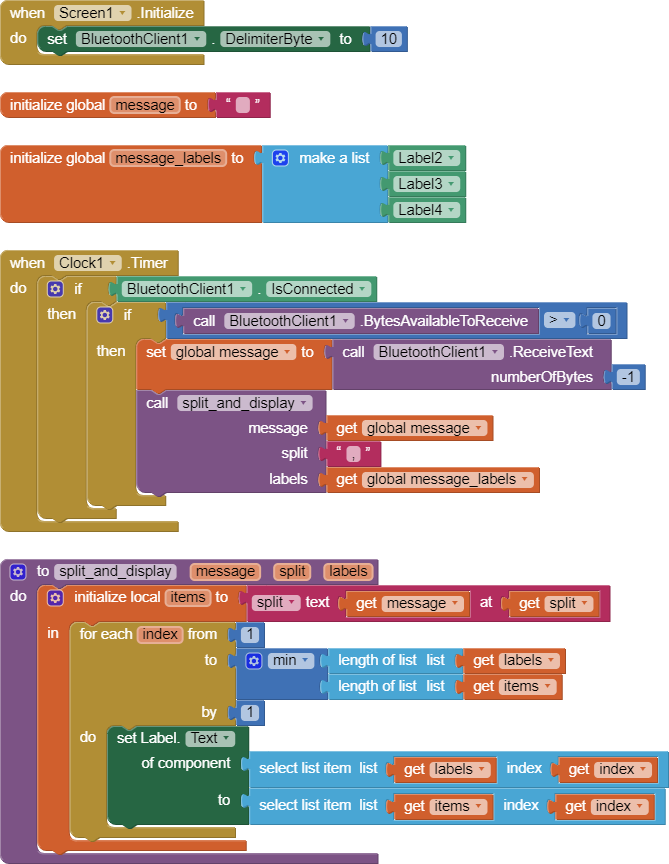
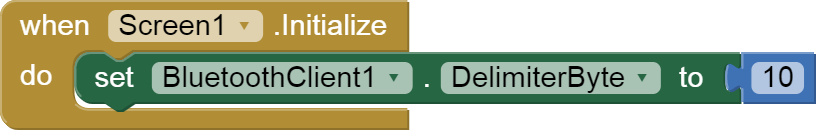
In the AI2 Designer, set the Delimiter attribute of the BlueTooth Client component to 10 to recognize the End of Line character.
Also, return data is not immediately available after sending a request,
you have to start a Clock Timer repeating and watch for its arrival in the Clock Timer event. The repeat rate of the Clock Timer should be faster than the transmission rate in the sending device, to not flood the AI2 buffers.
In your Clock Timer, you should check
  Is the BlueTooth Client still Connected?
  Is Bytes Available > 0?
     IF Bytes Available > 0 THEN
       set message var  to BT.ReceiveText(-1)
This takes advantage of a special case in the ReceiveText block:
ReceiveText(numberOfBytes)
Receive text from the connected Bluetooth device. If numberOfBytes is less than 0, read until a delimiter byte value is received.
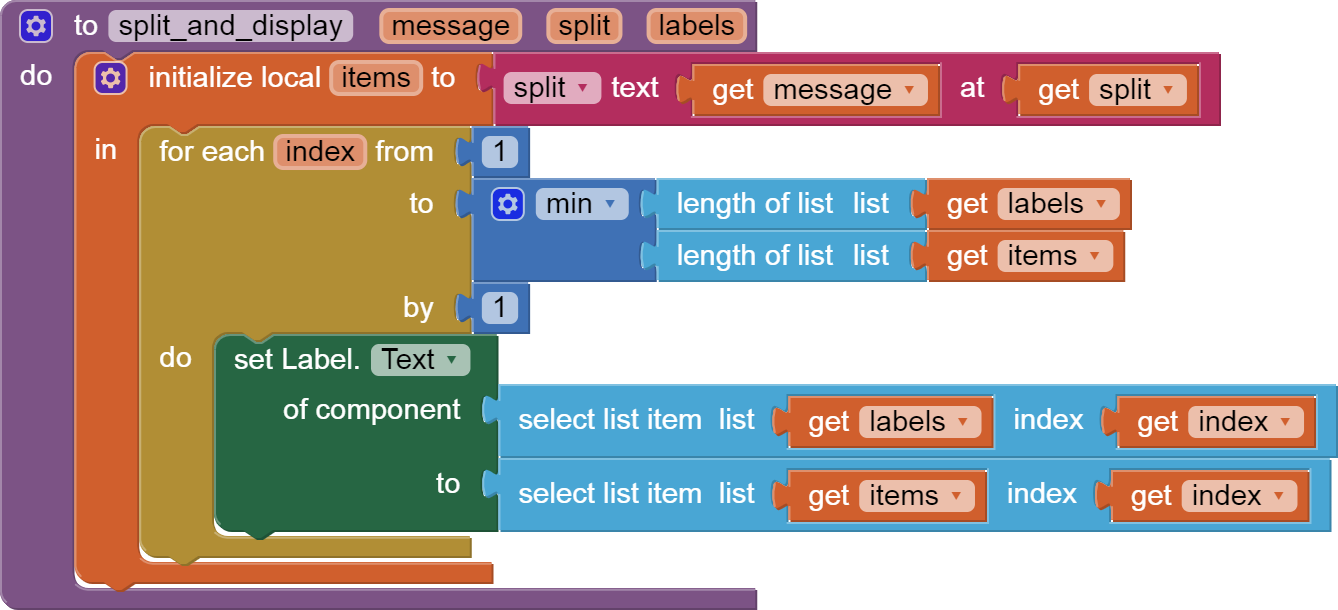
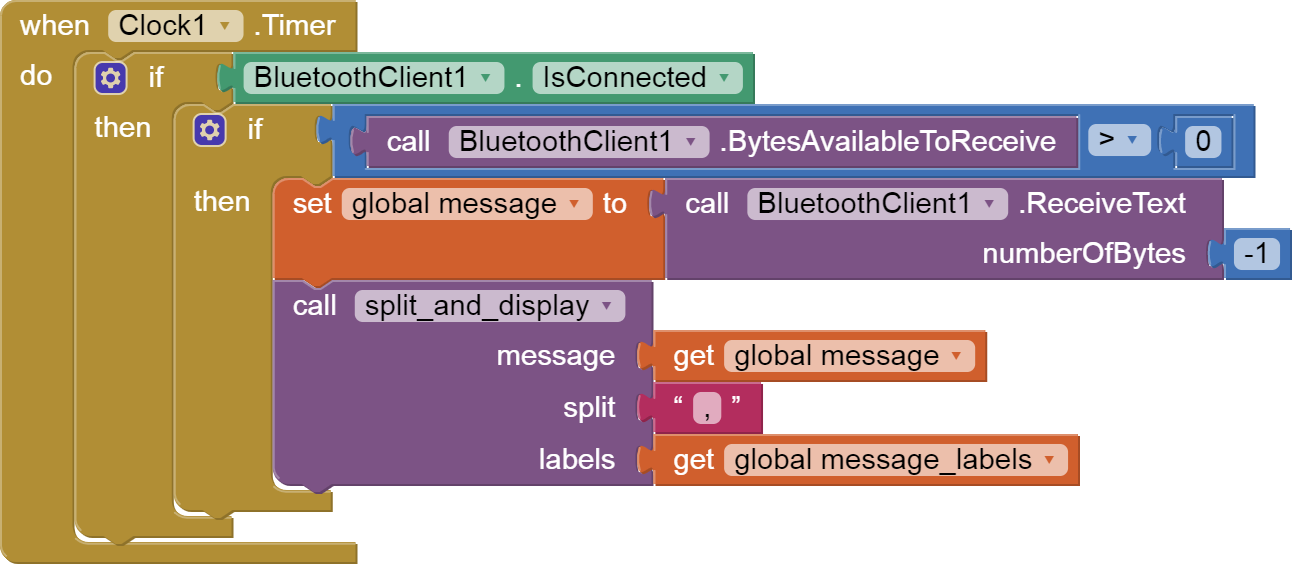
If you are sending multiple data values per message separated by | or comma, have your message split into a local or global variable for inspection before trying to select list items from it. Test if (length of list(split list result) >= expected list length) before doing any select list item operations, to avoid taking a long walk on a short pier. This bulletproofing is necessary in case your sending device sneaks in some commentary messages with the data values.
Some people send temperature and humidity in separate messages with distinctive prefixes like "t:" (for temperature) and "h:" (for humidity).
(That's YAML format.)
The AI2 Charts component can recognize these and graph them. See Bluetooth Client Polling Rate - #12 by ABG
To receive YAML format messages, test if the incoming message contains ':' . If true, split it at ':' into a list variable, and find the prefix in item 1 and the value in item 2.
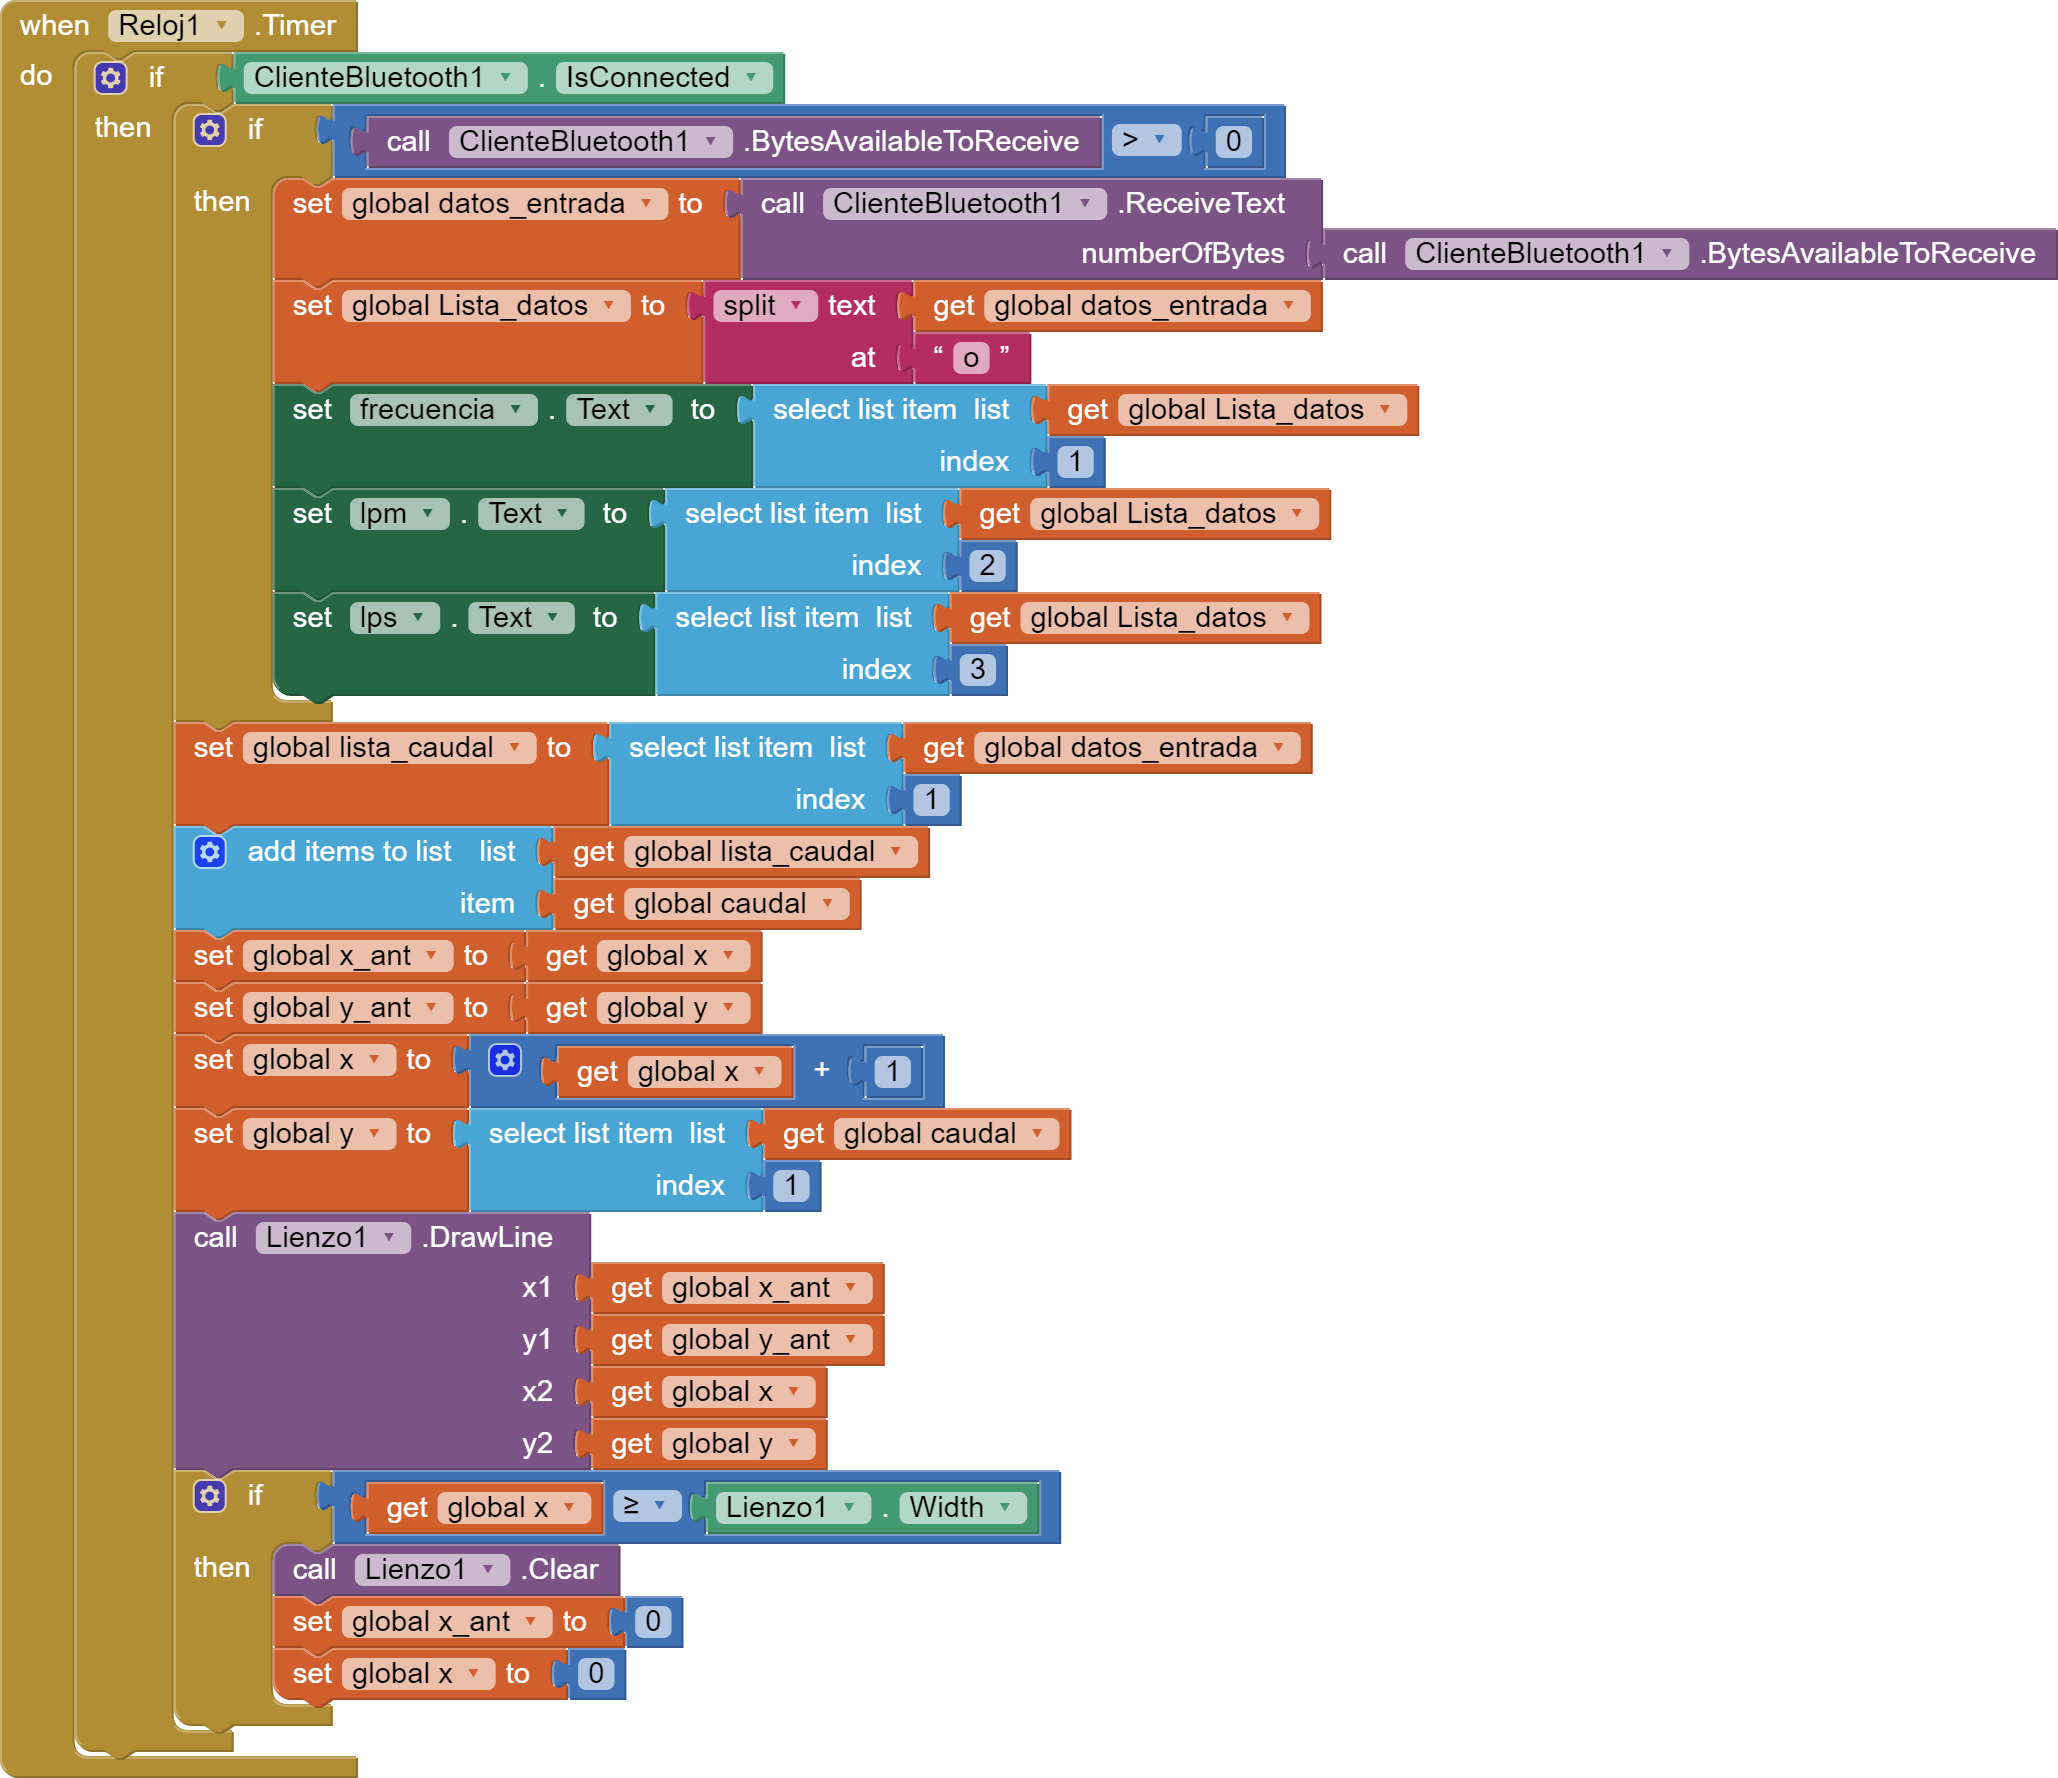
Hello, I modified the blocks but I get this error
The operation DrawLine cannot accept the arguments: , [31], ["Caudal (L/h): 40.000 "], [32], ["Caudal (L/h): 0.000 "]
I don't understand you, what I think is that I'm telling him to graph what he cuts out which is flow: (l/h): value and well he can't graph that text or so I think but then I don't know how to make it graph a value Even if it is just that flow, the flow I am using is the following
#include <SoftwareSerial.h>
SoftwareSerialbluetooth(10, 11); // Configure the Bluetooth module on pins 2 and 3
volatile int NumPulses; // Variable for the number of pulses received
int PinSensor = 2; // Sensor connected to pin 4
float conversion_factor = 7.5; // Conversion factor to convert from frequency to flow
unsigned long lastMillis = 0; // Variable to keep track of time
unsigned long interval = 1000; // Time interval between records in milliseconds (1 second)
void CountPulses()
{
PulseNum++; // We increase the pulse variable
}
void setup()
{
Serial.begin(9600); // Initializes serial communication at 9600 baud
bluetooth.begin(9600); // Initializes Bluetooth communication at 9600 baud
pinMode(PinSensor, INPUT); // Set the sensor pin as input
attachInterrupt(digitalPinToInterrupt(PinSensor), CountPulses, RISING); // Configures an interrupt on the rising edge that calls the CountPulses function
}
void loop()
{
unsigned long currentMillis = millis(); // We get the current time in milliseconds
if (currentMillis - lastMillis >= interval)
{
float frequency = NumPulses; // We obtain the pulse frequency (pulses per second)
float flow_L_m = frequency / conversion_factor; // We calculate the flow in liters per minute (L/m)
float flow_L_h = flow_L_m * 60; // We calculate the flow in liters per hour (L/h)
 // We send the calculated values in columns through the serial port
 Serial.print("Frequency (Hz): ");
 Serial.println(frequency, 0); // Frequency in Hz
 Serial.print("o");
 Serial.print("Flow rate (L/m): ");
 Serial.println(flow_L_m, 3); // Flow rate in L/m
 Serial.print("o");
 Serial.print("Flow rate (L/h): ");
 Serial.println(flow_L_h, 3); // Flow rate in L/h
 Serial.print("o");
and I don't understand the "chart" thing, according to what I was looking at, it doesn't help me to receive the bluetooth data, I don't know if I'm looking at it wrong, sorry for so many messages :c
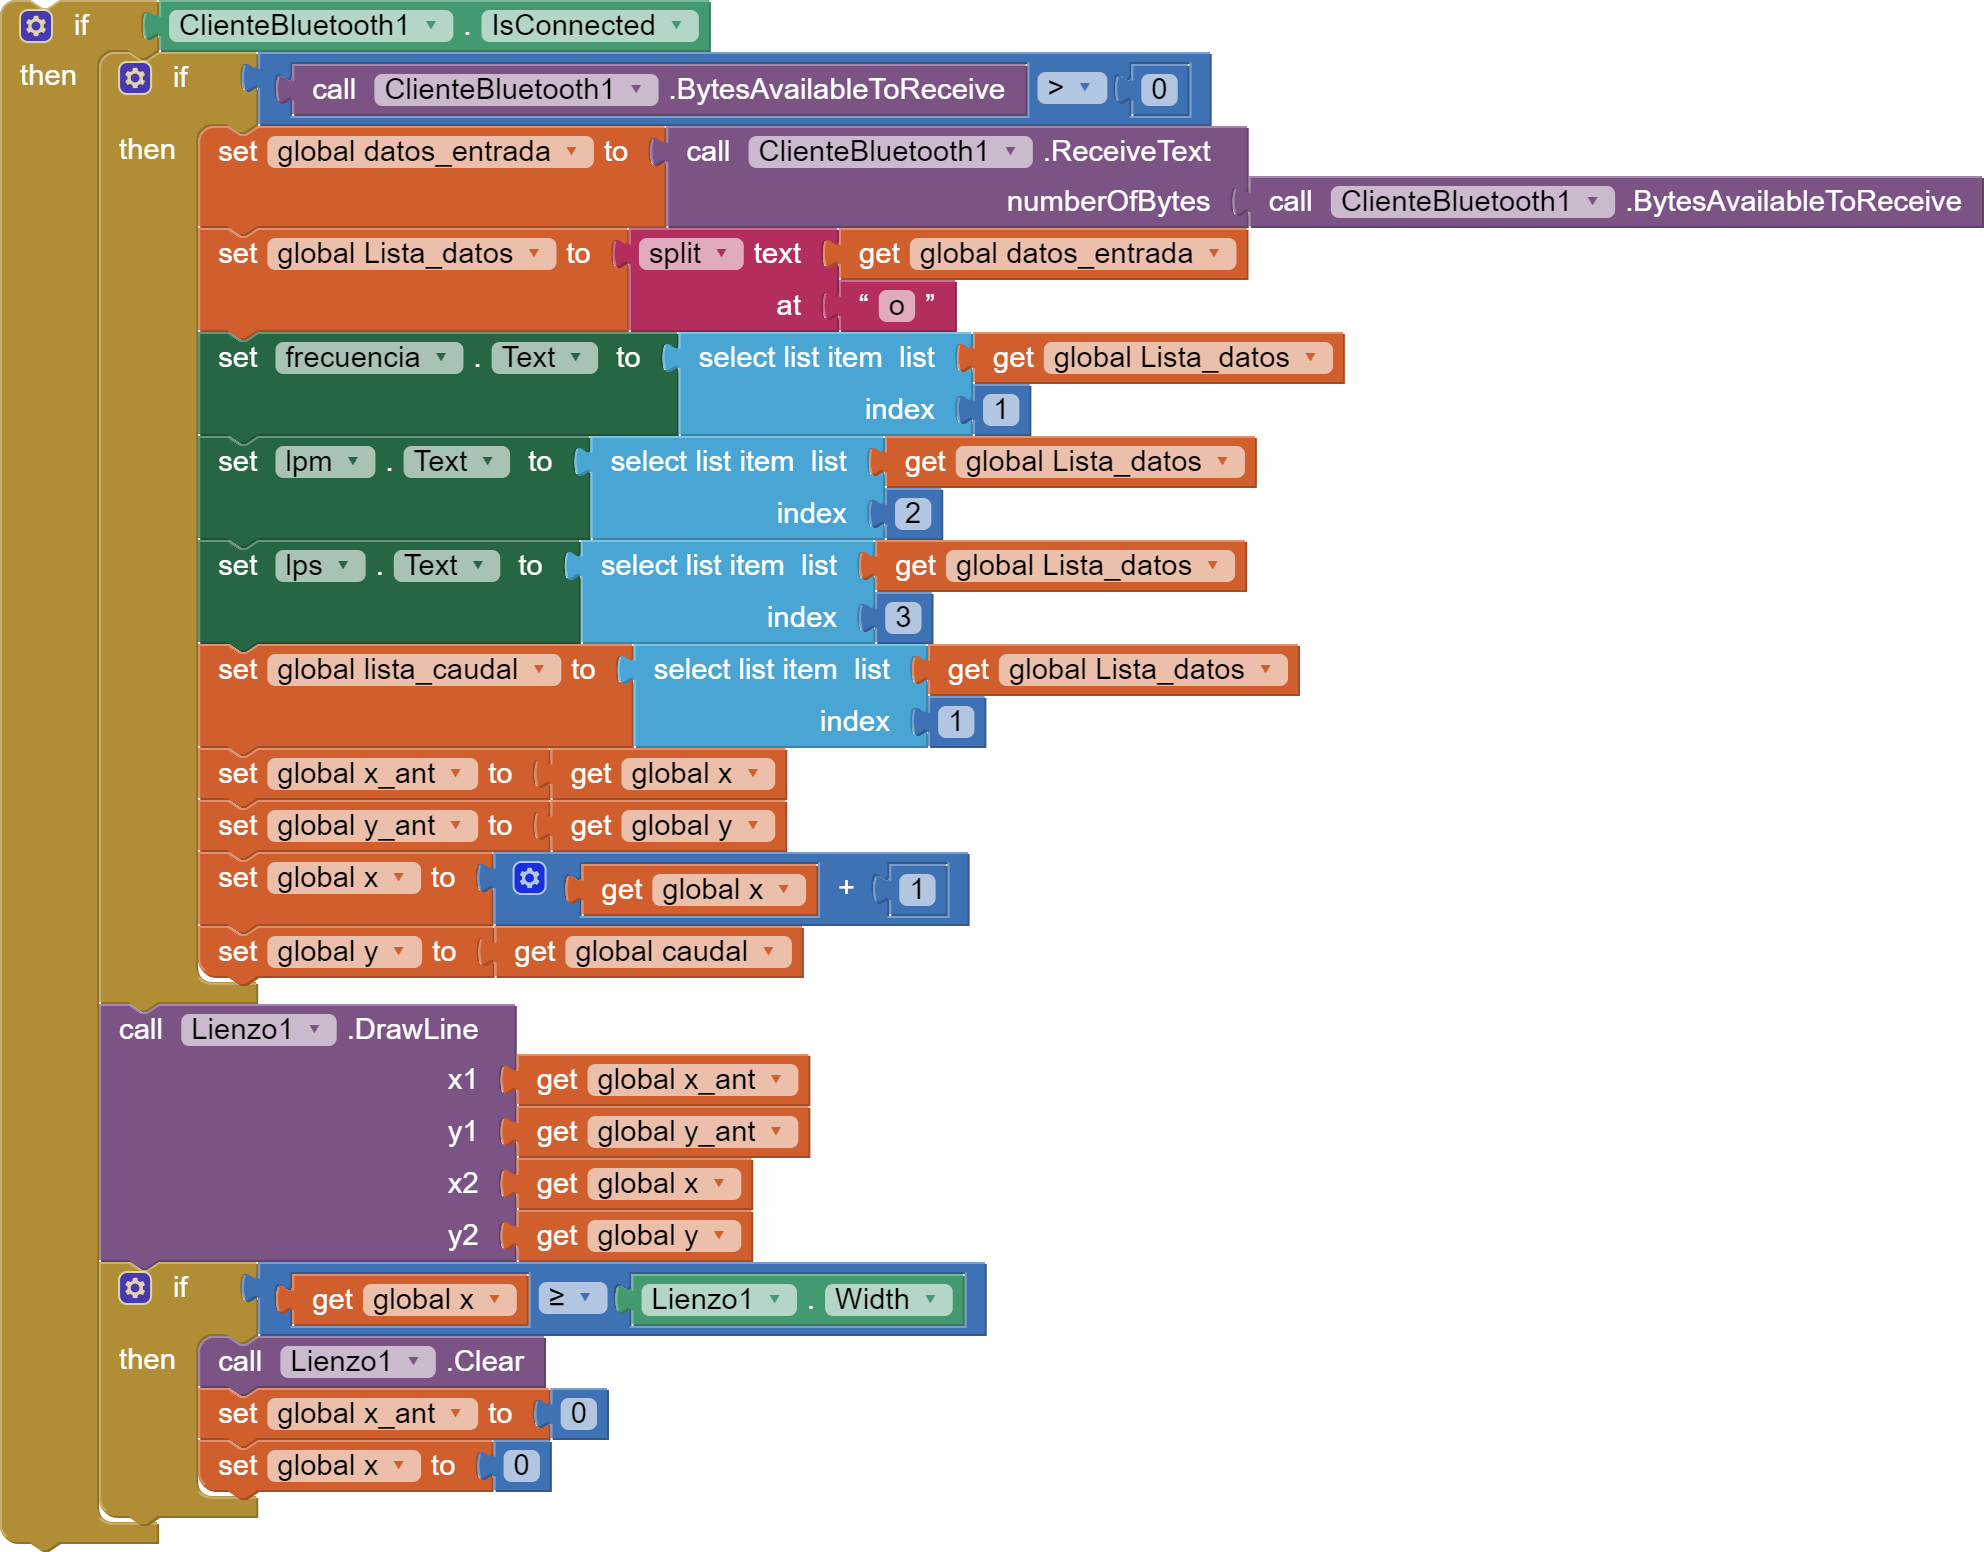
The error mesge translates in
X1=31
Y1=Caudal (L/h): 40.000
X2= 32
Y2=Caudal (L/h): 0.000
You now might understand, that the DrawLine method is not able to understand the Y values
Taifun
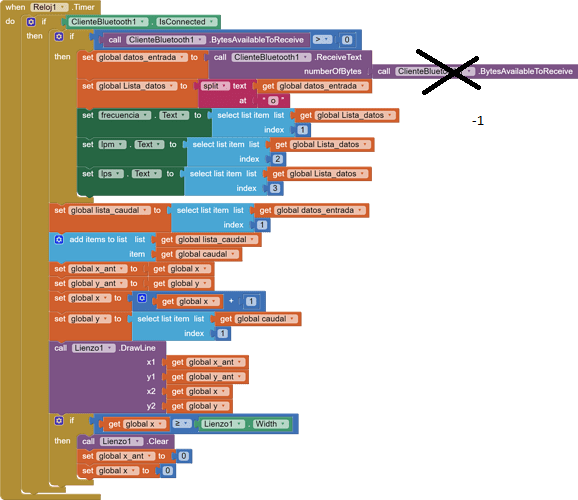
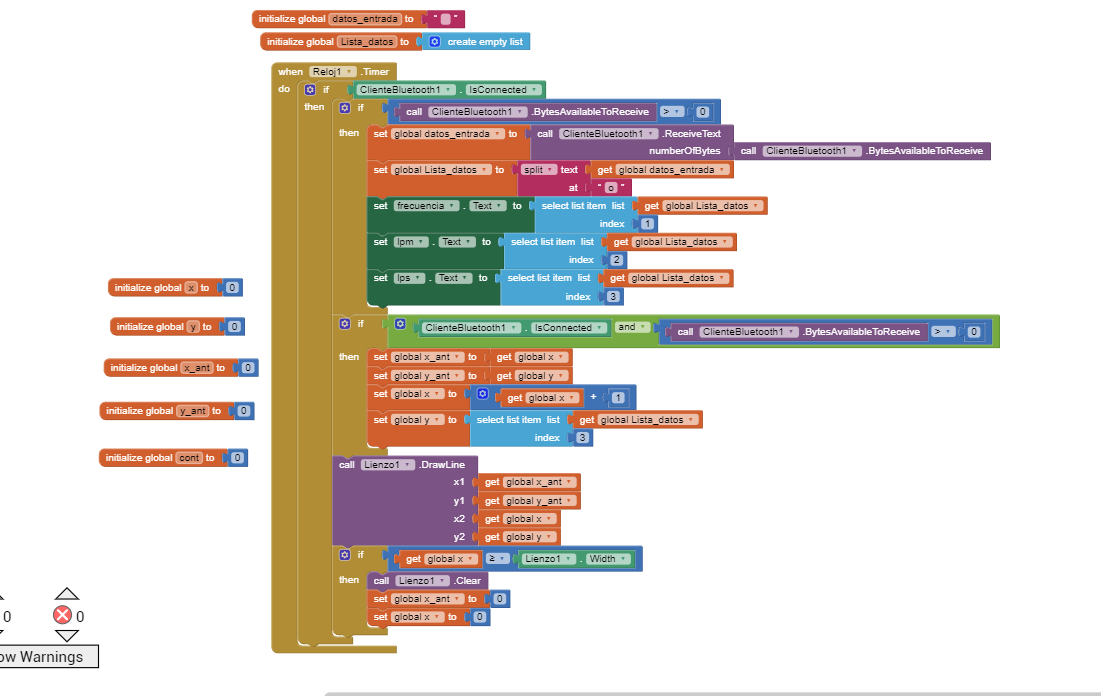
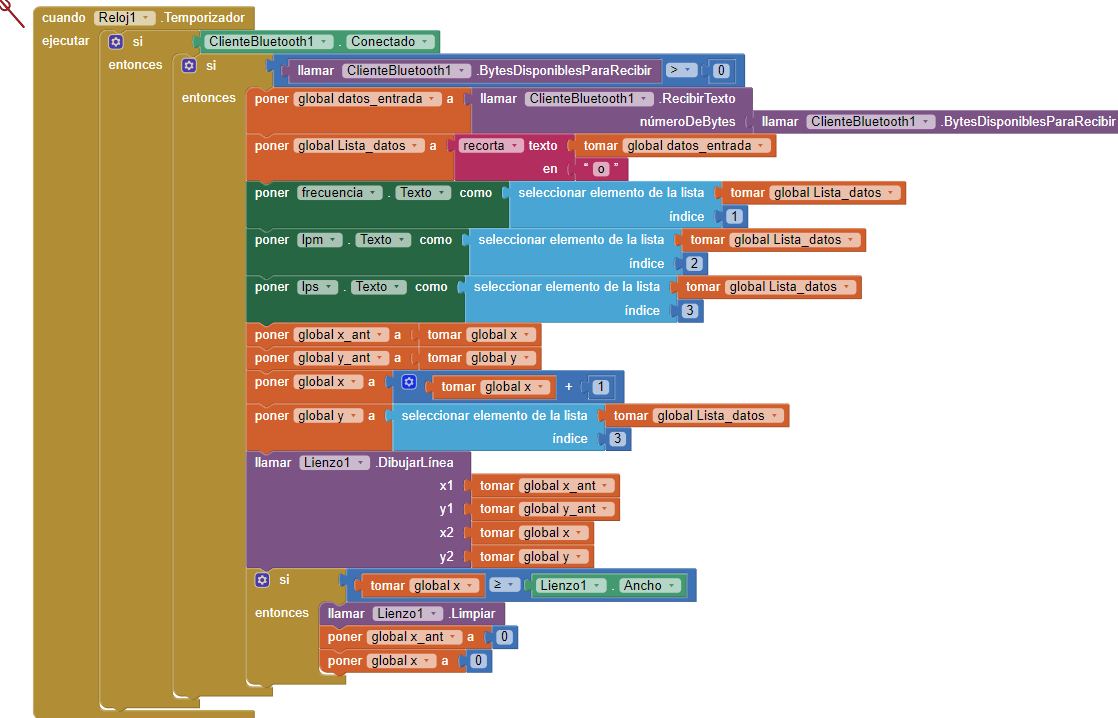
Here is an updated blocks sample illustrating these ideas ...

I think you're not understanding me, look, according to what I've been reviewing, it's because it doesn't create a separate list, plus I separate the numbers, but it tries to graph everything including the text, so I don't know.
I seriously don't know what to do, I've tried many ways and nothing, I don't know what to do anymore :,c