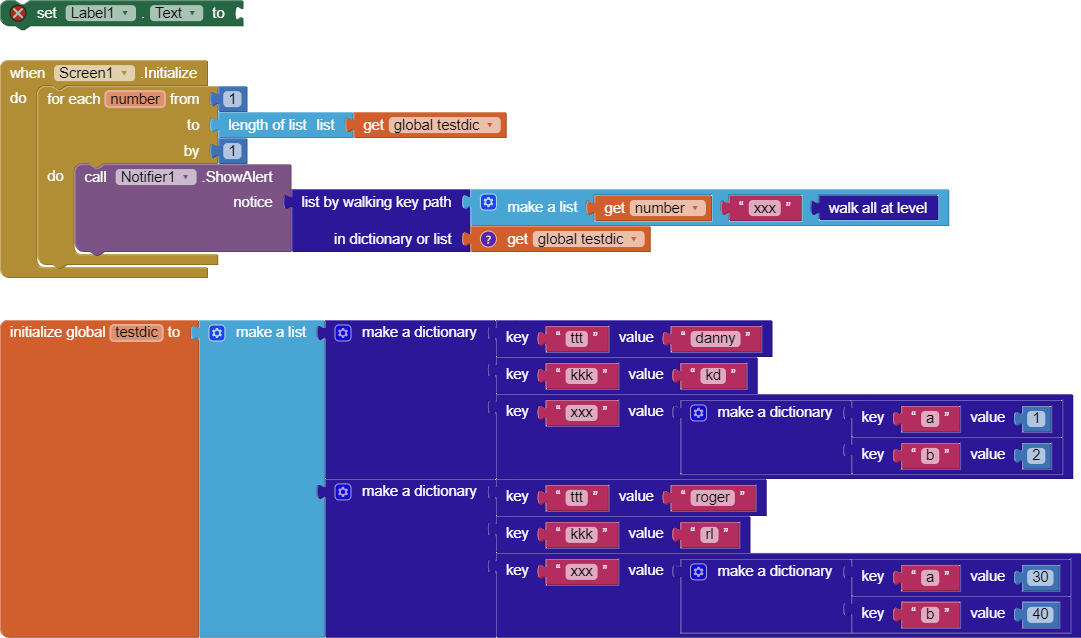
I found that “List by walking key path” does not work as expected when being put in a For Next or While Test Do loop. Appreicate if you can give me a hint. Thanks.
(upload://maucXQWXrsXm3fJoFfip7uWLTtY.png)
I found that “List by walking key path” does not work as expected when being put in a For Next or While Test Do loop. Appreicate if you can give me a hint. Thanks.
(upload://maucXQWXrsXm3fJoFfip7uWLTtY.png)
please upload your screenshot again
Taifun
What results did you get?
What were you expecting?
Upload the .aia export so we can repeat the experiment too.
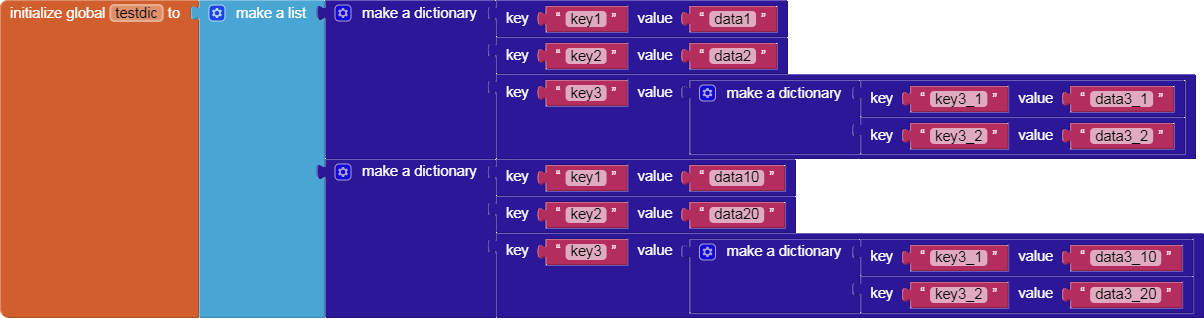
I want to extract the data from a list of dictionaries using a for loop. All the following screens are in the attached aia file.
In example 1 (Screen1), I got the 2 alerts showing “data3_1, data3_2” and “data3_10, data3_20” respectively. (that’s what I want)
In example 2 (Screen2), I got no alerts pop-up. (that’s the issue)
In example 3 (Screen3), I got 2 alerts showing “1”, “2”. (just to prove that the for loop works)
Thanks.
Confirmed.
I get a stall and a Java memory filled error when running Screen2.
This happens both when transferred from Screen to Screen2 and started up fresh in Screen2.
Tested in the stock Ai2 emulator, companion upgraded first.
Loom video test run …
I have confirmed that the block doesn’t work inside of a loop, but I have not been able to replicate the out of memory issue @ABG reported. I think I have a potential fix.
@ABG Would you mind getting an adb logcat after the OOM error occurs? I’m not sure why this would be and I can’t replicate it in the newer emulator.
Here’s a logcat from my Windows cmd window buffer.
It leaves out a lot of repetition.
Let me know if you need the full logcat from startup.
testDic Screen2 Logcat.txt (16.1 KB)
Okay, here’s a full Screen2 logcat from Companion startup to untimely end.
ABGlogcat.txt (928.5 KB)
Thanks @ABG. I think the issue is that the garbage collector couldn’t keep up. Basically, by having the code in the Initialize block, it immediately generates an error, which propagates back to the editor. The editor sees the error state, and tries to send the code chunk-by-chunk to identify which part of the code is problematic. However, when it comes to the initialize event again, it fails so tries to start over, entering this perceived infinite loop. By reconstructing the screen on every loop, it creates more and more garbage. Eventually, the GC fails and throws the OutOfMemoryError.
What was the error, so we can warn people not to do it?
There’s not really anything we can warn people against other than using the Initialize block. The underlying issue was that some Scheme code changes were poorly placed, and so it resulted in the walk all at level block to not be recognized as valid when used within loops. Because of that bug, an error is thrown that gets propagated back to App Inventor. Now on the web side, we have some code to help people identify errors due to badly configured blocks, which sends each stack separately rather than as a whole program. Unfortunately, because the error is a runtime error in the Initialize block, the system gets stuck in this loop where it tries to run the code, it fails, it tries to run the code, it fails, ad infinitum until the OOM error occurs. On older devices, the garbage collector can’t keep up. On newer devices with 2x CPUs, it usually runs in parallel so it just ends up looking like an infinite loop (which it is until you switch projects or disable the event).
This topic was automatically closed 7 days after the last reply. New replies are no longer allowed.