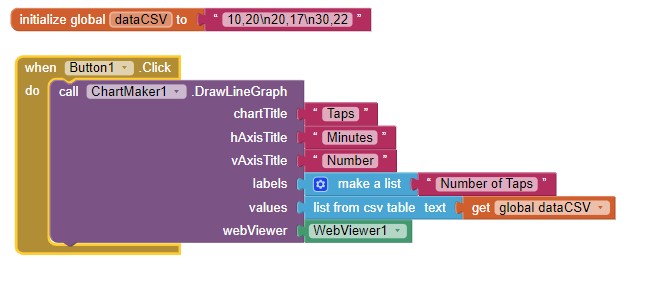
Hello, I have created an app that is called Taps. The porpuse of this app is to make as much taps as posible in a certain time, for example: 5,10 or 30 seconds. The screen shows a countdown, a button where you have to tap and the number of taps. For that reason, now I wonder if I can generate a line graphic in order to show the number of taps you have made for each second during the interval time. So the graphic (X,Y) will contain X= Time (1,2,3...) seconds and Y= Number of taps.
I have been making some research here in the forum but I have not found any line graphic like the one I have in mind. I know hardly anything about programming and I find it a bit difficult to make that, so if anyone find something explained quite similar to the line graphic I want to do I will be grateful.
Thank you.