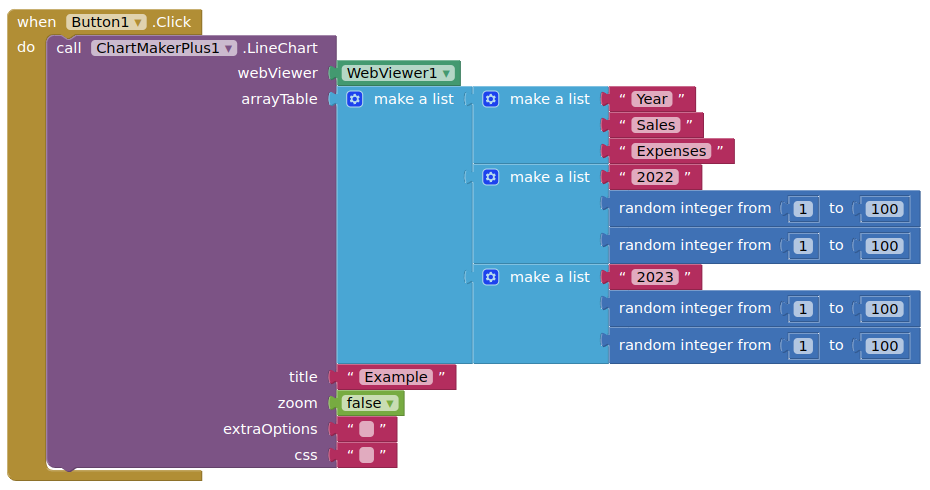
Where Year is displayed on the horizontal axis, and Sales and Expenses are the two lines on the chart.
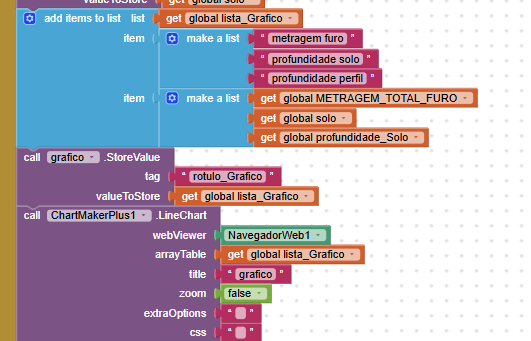
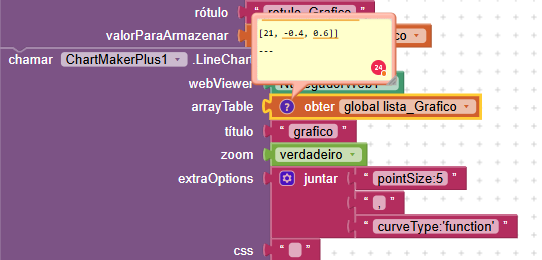
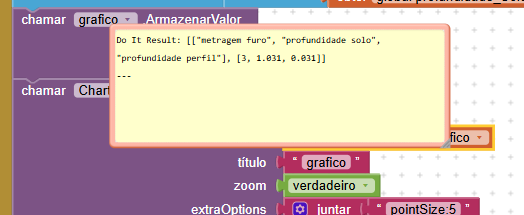
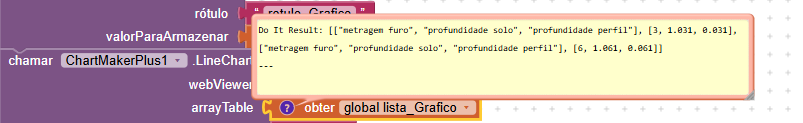
Apart from the three headings in the first sublist, all the other entries should be numbers.
You can perhaps get an idea of how things are constructed by looking at the google charts reference:
Ok, thank you very much, I will study a little more and try to understand where my error is. But probably my error is in the data storage, and not in the graph.