Sorry Everyone , I want make a pie chart in app inventor , and i want to use my google sheet data.
How can I to do this thing.
You can:
Build a chart on a canvas or many other options
Use google visualisation to create a chart and show in a webviewer
Make a chart on the google sheet, then export an image of it:
https://tanaikech.github.io/2020/06/23/workaround-correctly-exporting-charts-on-google-spreadsheet-as-images-using-google-apps-script/
I know how to make a chart on google sheet , but i don't know how can let app inventor to get that chart and show the chart
@TIMAI2 already showed you several different options...
choose one of them, try it and if you don't like that solution try the next one...
there also is this method How to generate an animated Pie Chart using the Chart.js library
Taifun
Trying to push the limits! Snippets, Tutorials and Extensions from Pura Vida Apps by ![]() Taifun.
Taifun.

Put your responseContent in a label. What does your responseContent look like?
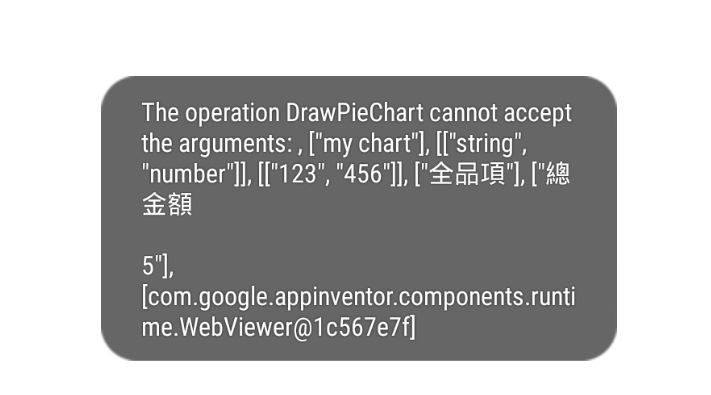
I use notifier to show response Content , and it show this.
Please teach me how can i solve this problem.

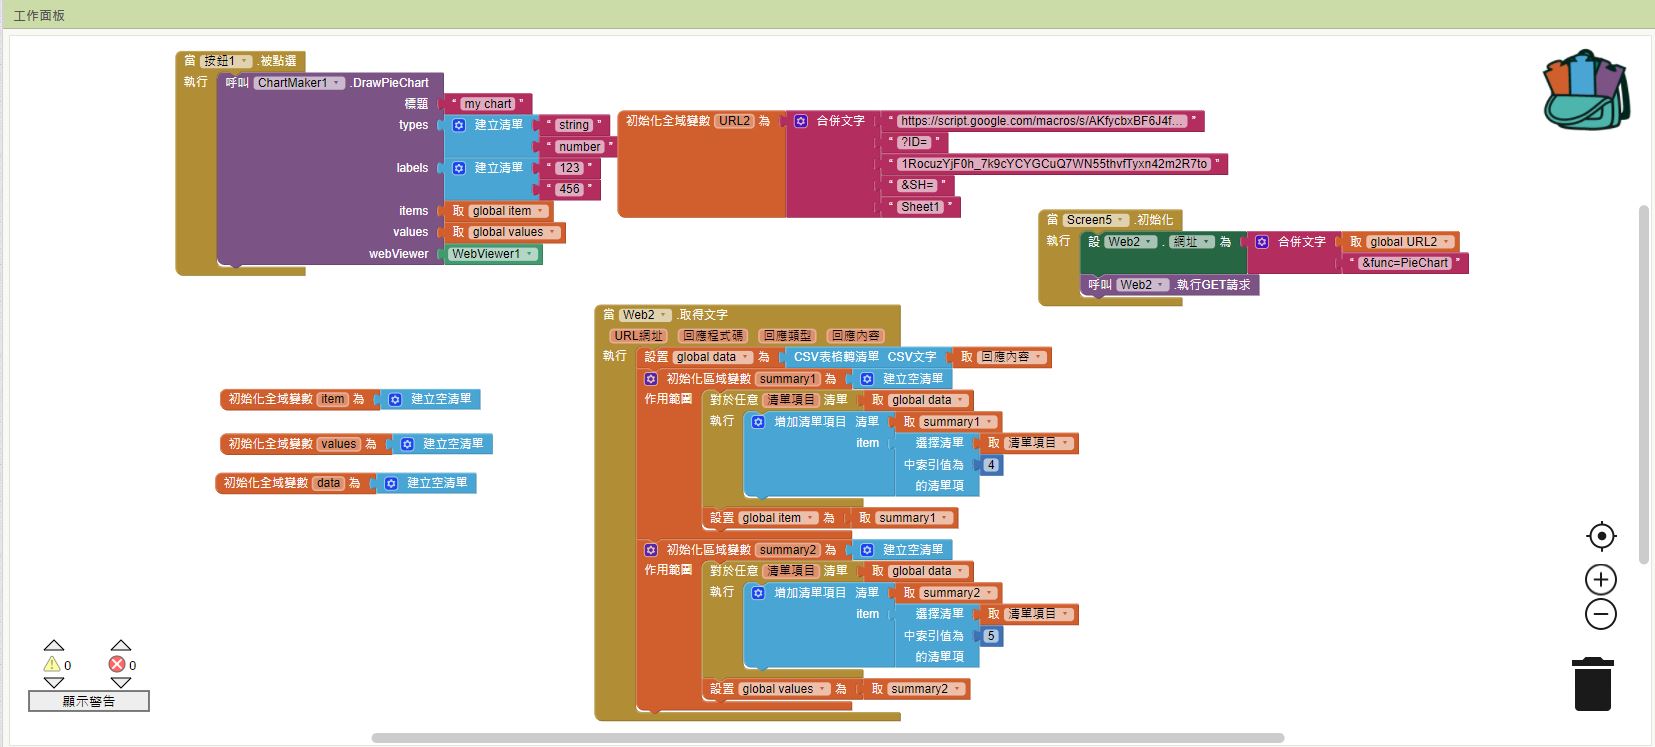
Here is an example for you to follow:
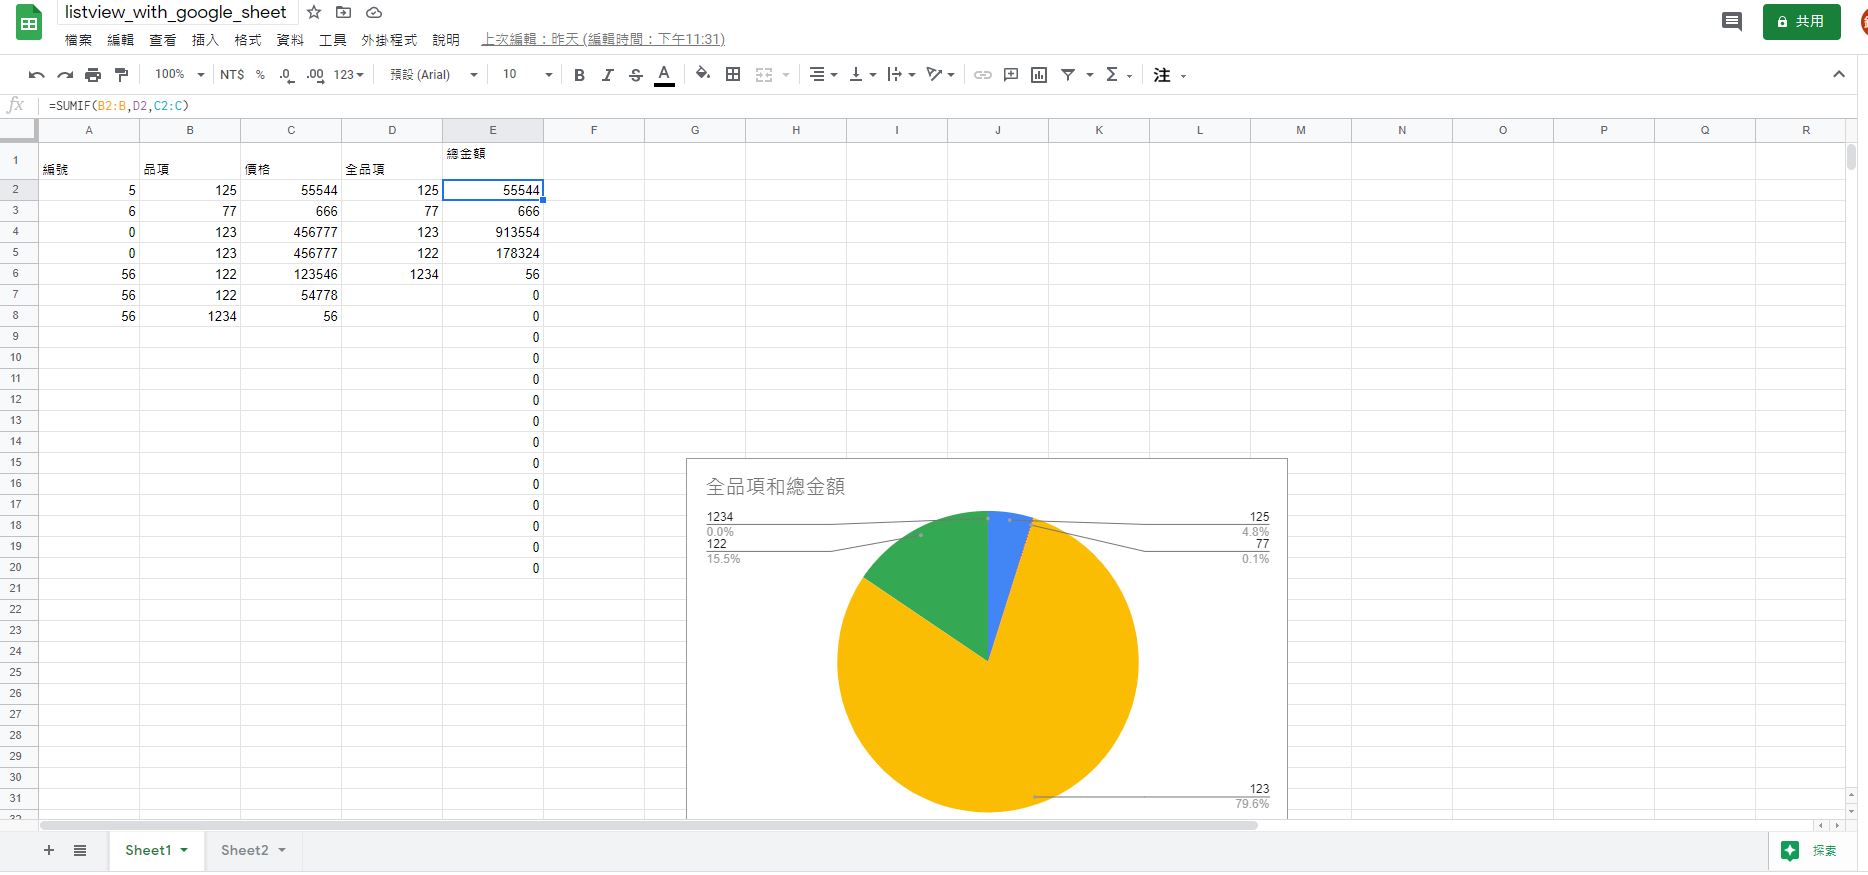
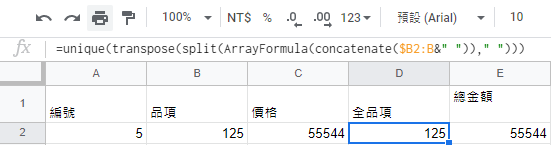
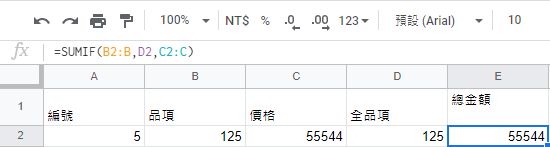
You appear to be selecting the following range to create your chart on the sheet:
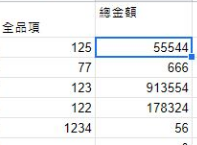
I have recreated this on a separate sheet:
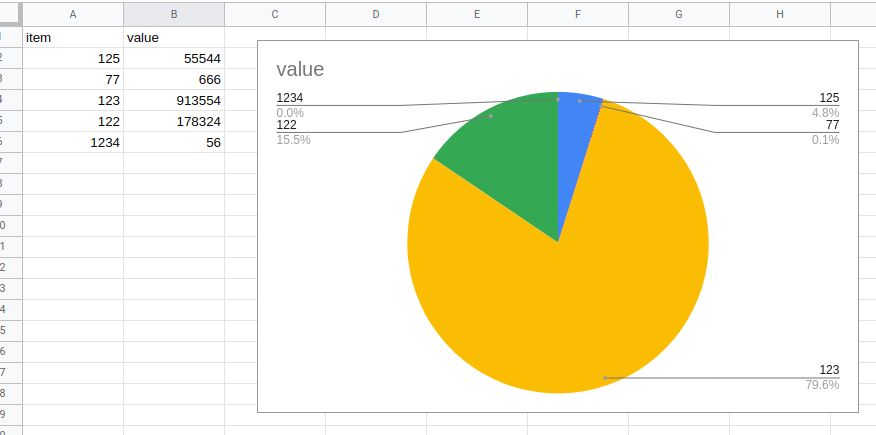
I will use this as a data range to fetch from the spreadsheet to build the chart with chartmaker. My example has the spreadsheet open for anyone with the link.
I need to fetch only the range which in my example is A2:B6 (in your example D2:E6 )
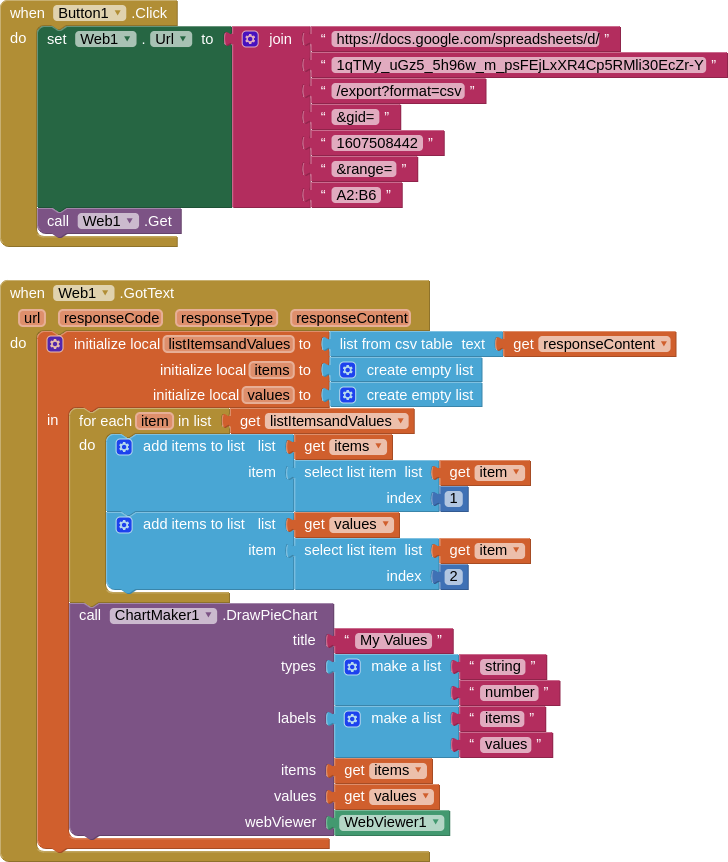
I will do this by creating a url with the spreadsheetID, the gid of the sheet(the grid id for the sheet the data is on), and the range A2:B6.
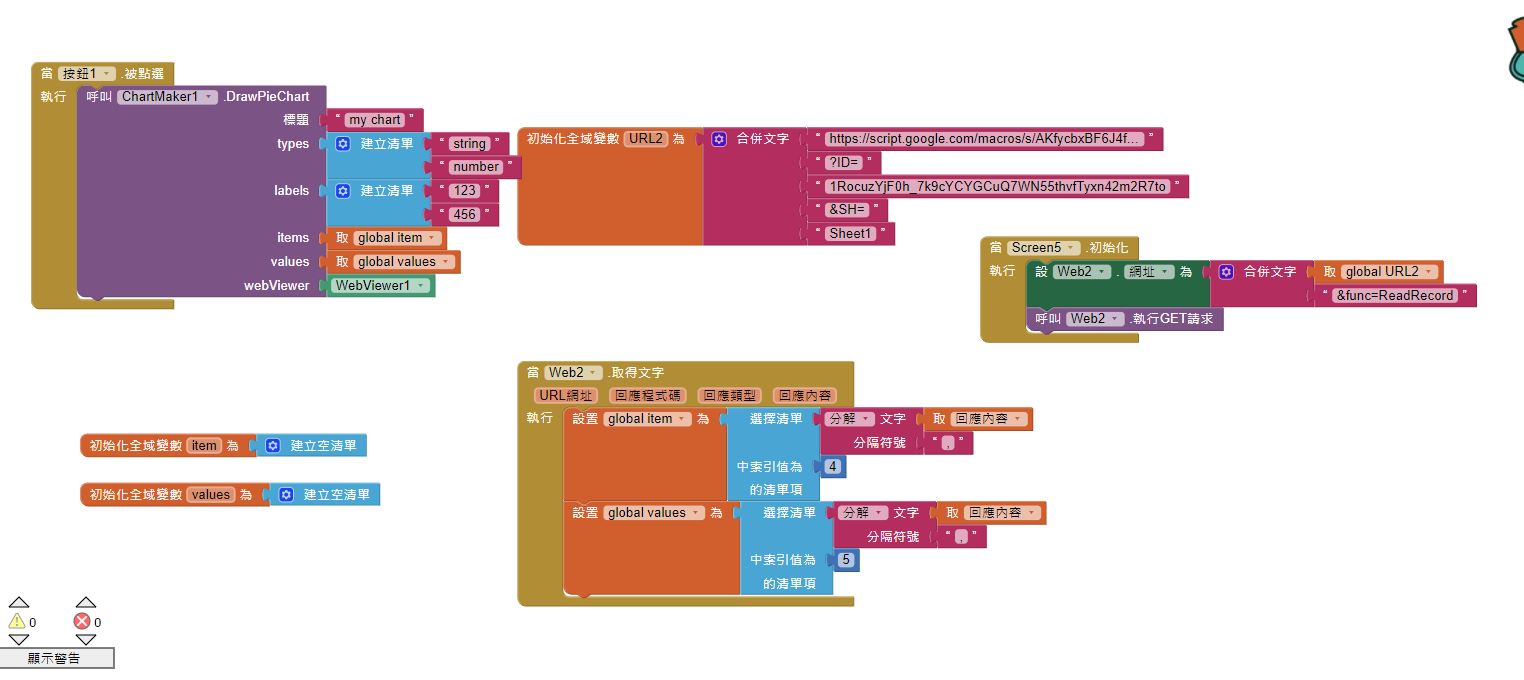
Once the data is returned in responseContent, I convert this csv table to a list, then I make two lists, one for the items, and one for the values. These are then fed to the chartmaker block to make the chart
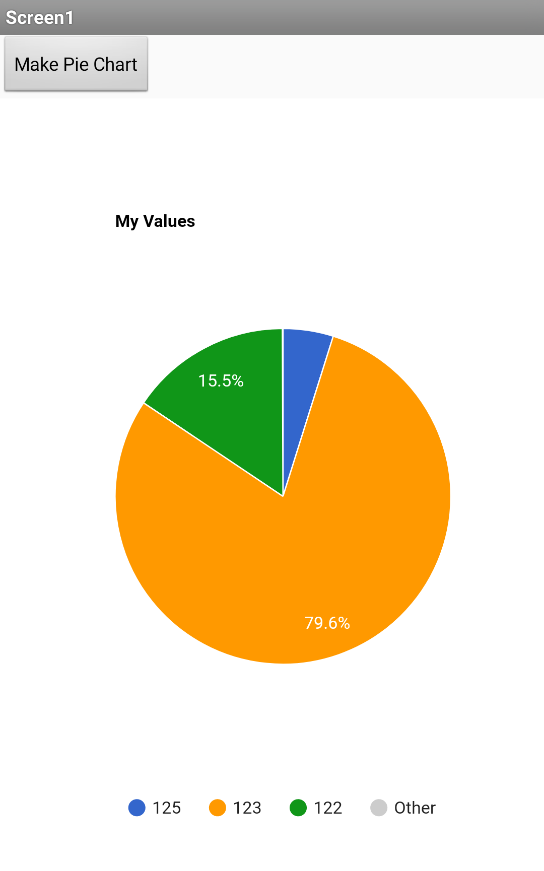
The resultant chart:
Does this help ?
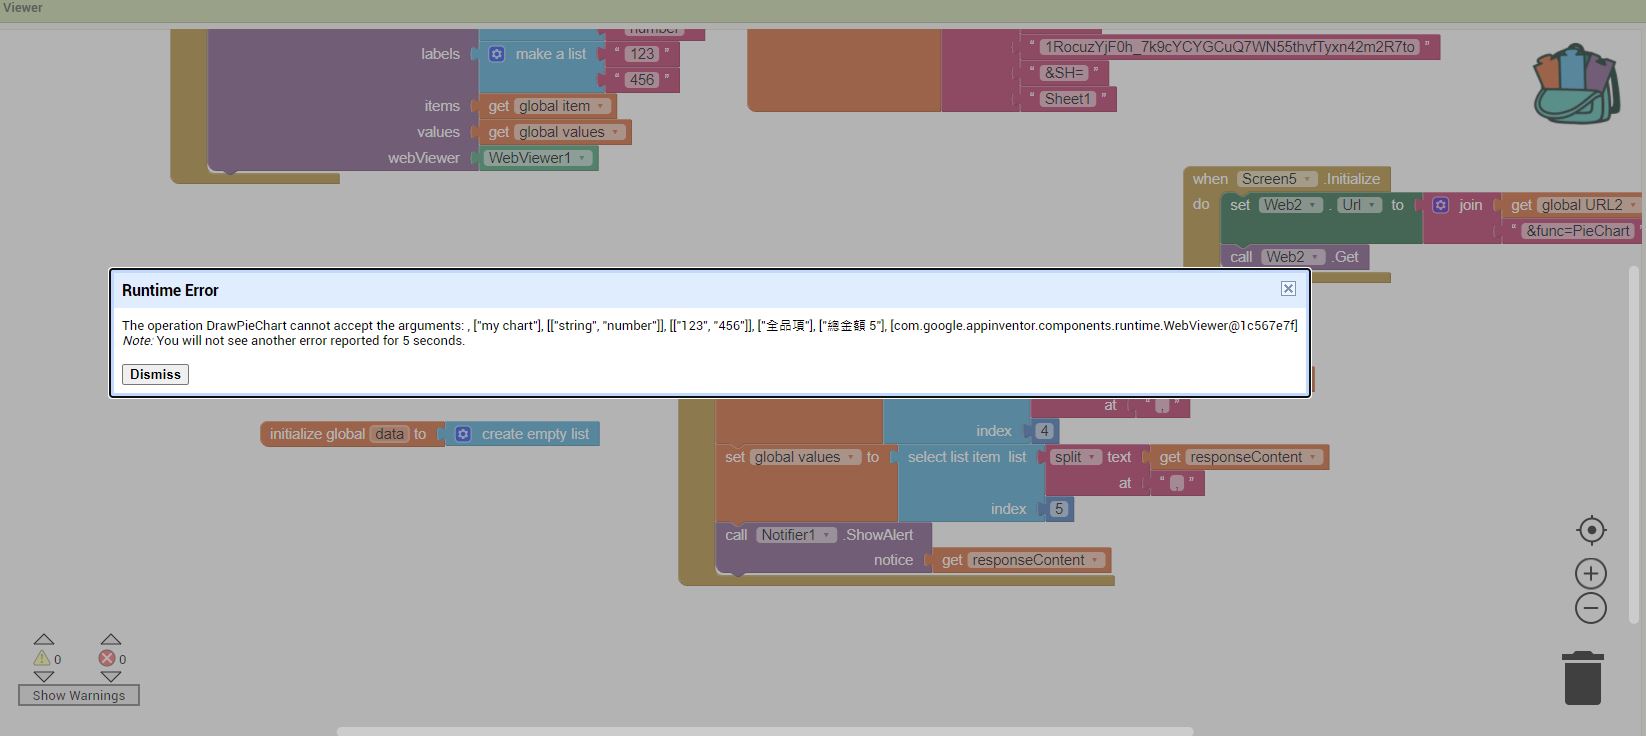
sorry i copy from your program,but it's show error.
I find the problem,but I don't no how i can salvo.
I find it maybe is not values , it's formula.
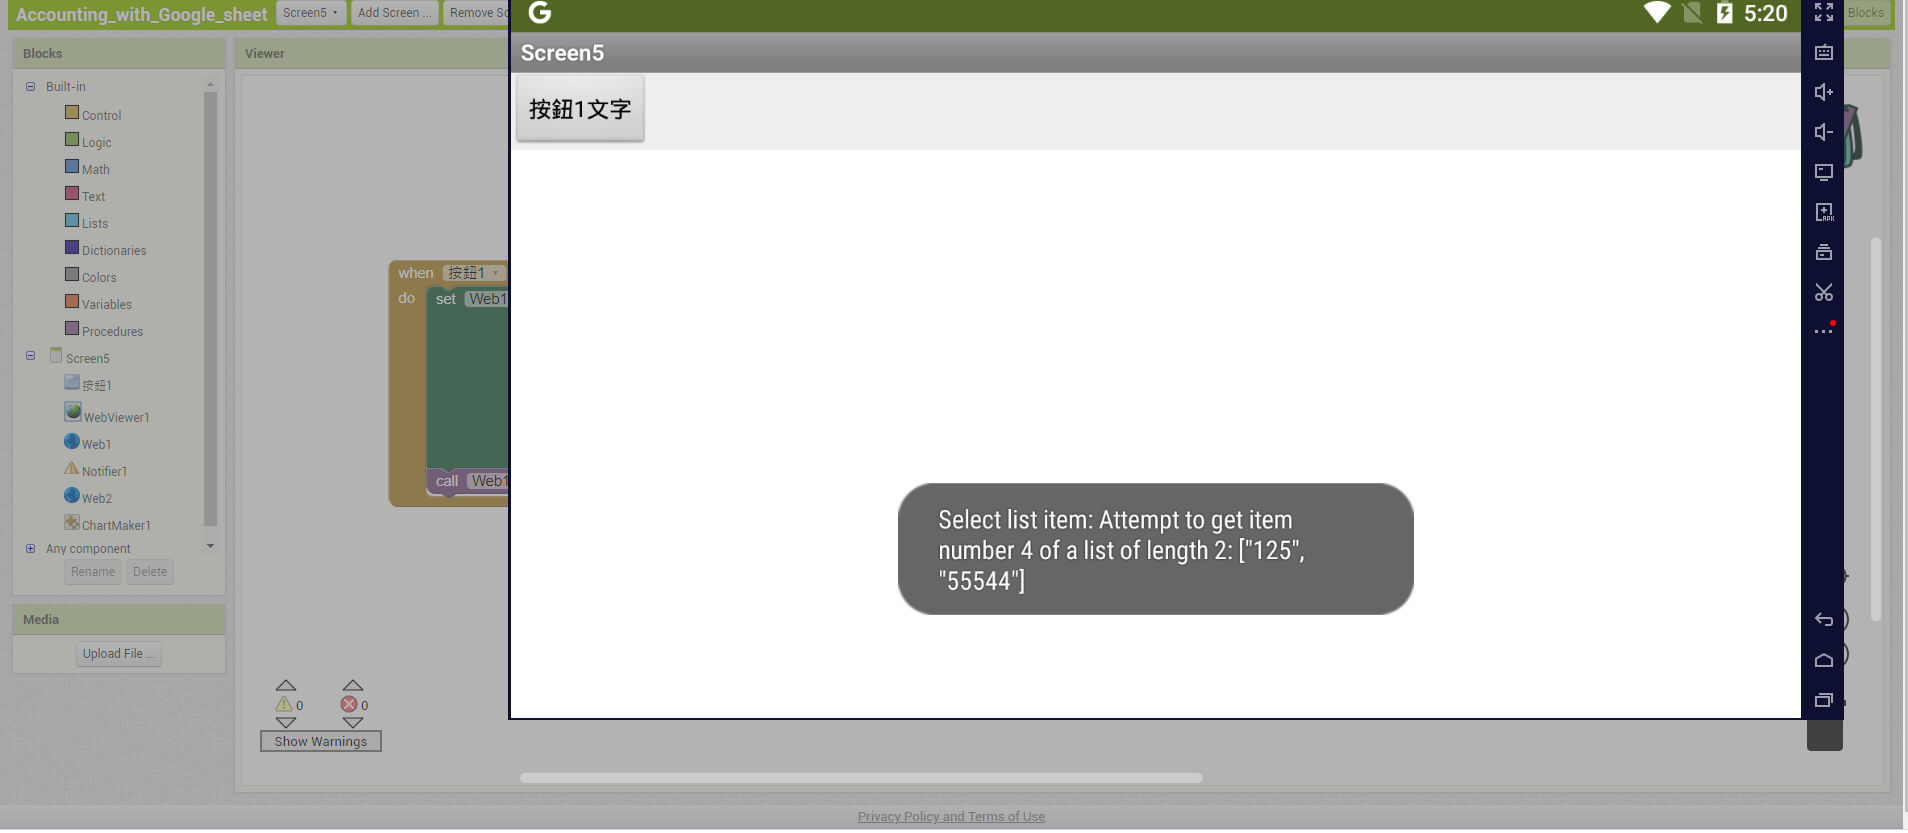
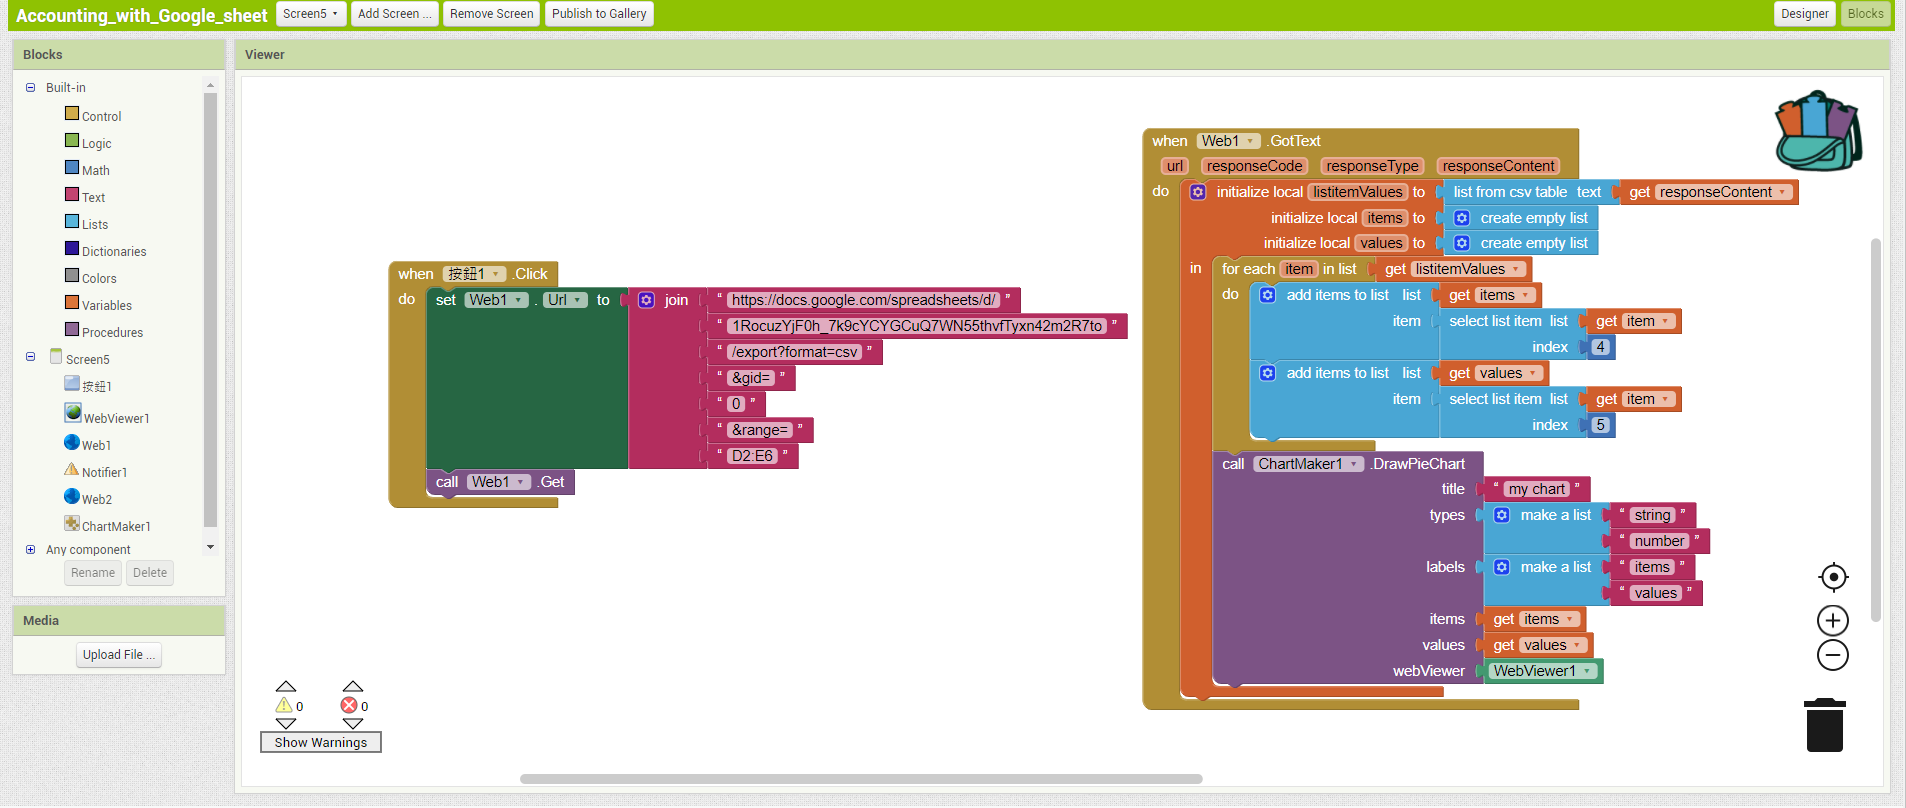
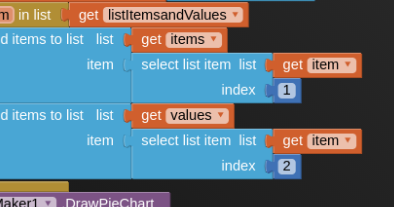
Where you have indexes 4 and 5 in the Web1.GotText, you need indexes 1 and 2, like my example, because you have only returned two columns of data.
so i need indexes all values?
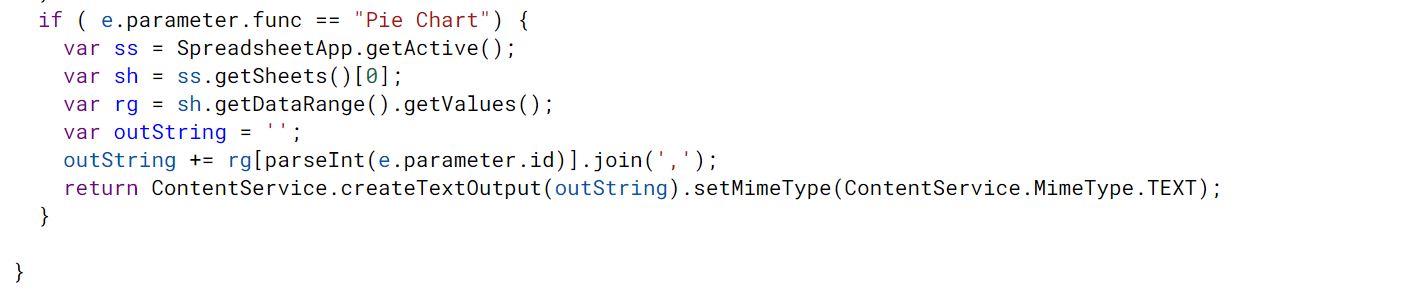
Just change this:
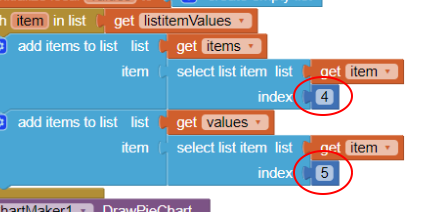
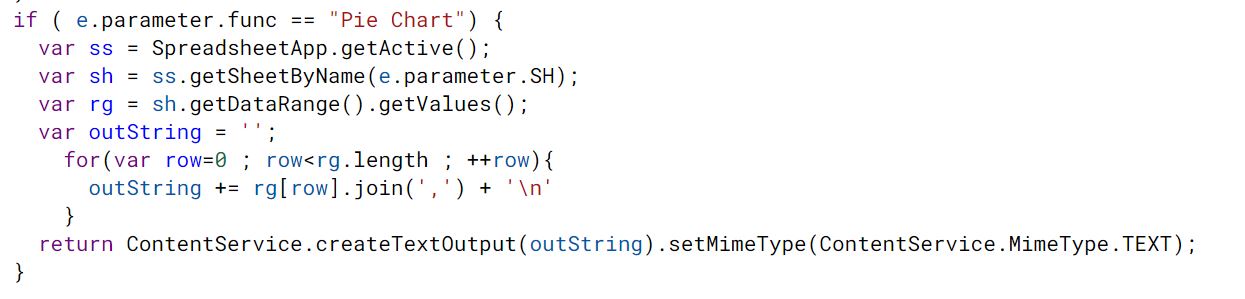
to this:
oh! thank for you help i made it.
thank for your help.
I appreciate your help very much.

Well done 
This topic was automatically closed 7 days after the last reply. New replies are no longer allowed.