hello,good time.I’m math student.
I want to draw function diagrams with canvas component in appinventor, and want to interact with the user, can you help me?
What have you tried ? What works, what doesn’t work ?
Have you followed any canvas tutorials or searched the current forum for ideas ?
2 Likes
No I just got acquainted with this program, after finding a lot of searching here, thank you so much for guiding us through Appinventor Training
I used canvas to draw graphs but unfortunately I can’t get it executed.
It would really help if you provided a screenshot of your relevant blocks, so we can see what you are trying to do, and where the problem may be.
A very good way to learn App Inventor is to read the free Inventor's Manual here in the AI2 free online eBook http://www.appinventor.org/book2 ... the links are at the bottom of the Web page. The book 'teaches' users how to program with AI2 blocks.
There is a free programming course here http://www.appinventor.org/content/CourseInABox/Intro and the aia files for the projects in the book are here: http://www.appinventor.org/bookFiles
How to do a lot of basic things with App Inventor are described here: http://www.appinventor.org/content/howDoYou/eventHandling .
Also do the tutorials Our Tutorials! to learn the basics of App Inventor, then try something and follow the
Top 5 Tips: How to learn ![]() App Inventor
App Inventor
You will not find a tutorial, which does exactly what you are looking for. But doing the tutorials (not only reading a little bit) help you to understand, how things are working. This is important and this is the first step to do.
Taifun
Trying to push the limits! Snippets, Tutorials and Extensions from Pura Vida Apps by ![]() Taifun.
Taifun.
1 Like
Can you post an example of what you want to do? I might have some stuff I did for testing.
Thank you very much for your guidance.

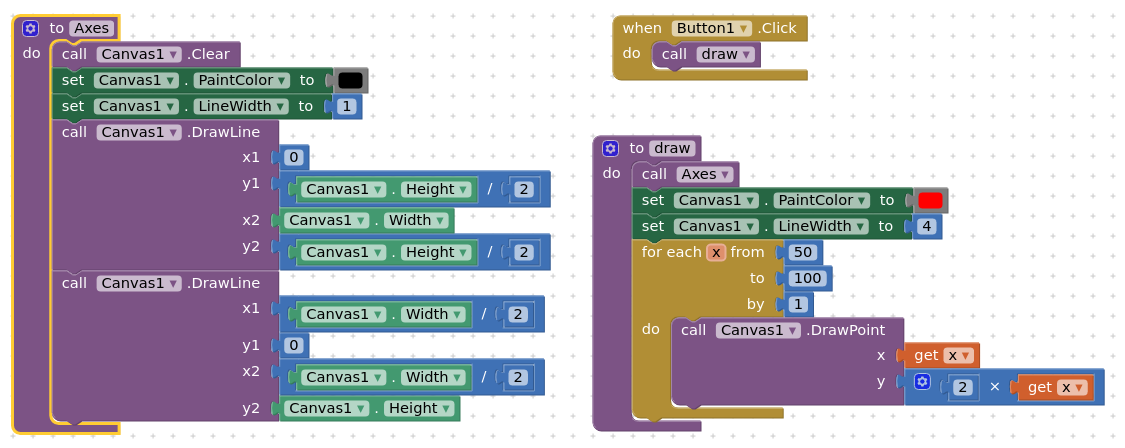
These are Blocks I wrote but have problems and are not working.
I didn’t see any
Thanks for introducing the site