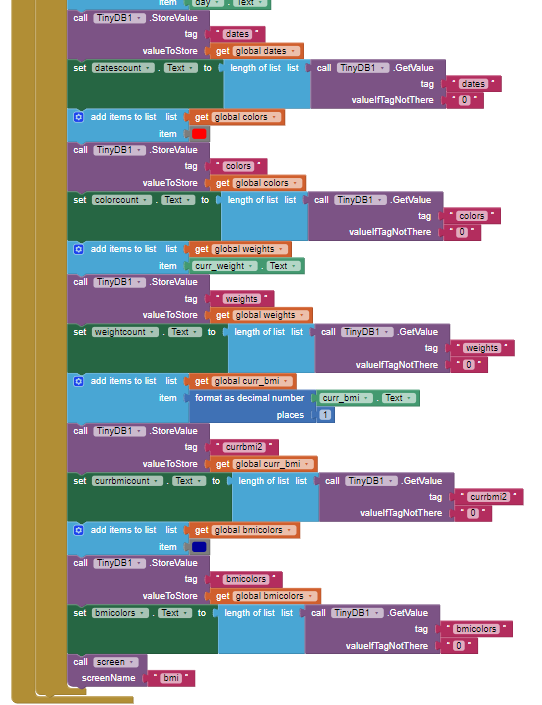
Hi, I'm trying to create a line graph from the data stored in tinydb. But it's not working. Can you tell me what is wrong here?
Here, Horizontal (X) axis - dates,
Vertical (Y) axis - BMI value,
Vertical (Y) axis - Weights
So, It should show two line (one for BMI, one for Weight) in the graph. I've to use only three value from tinyDB (dates, currbmi2, weights).
Can anyone please help me?

Look again at how the line graph data is constructed in the documentation, it is a sort of matrix....
Each sublist in values should contain one value from each of your three lists (date/currbmi2/weights)
So, how can I rearrange the blocks?
Unfortunately, I can't understand.