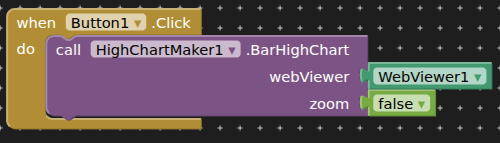
Simple demo app to graph a single variable using highcharts.
Values are passed via webviewstring.
Home page and javascript stored locally on device
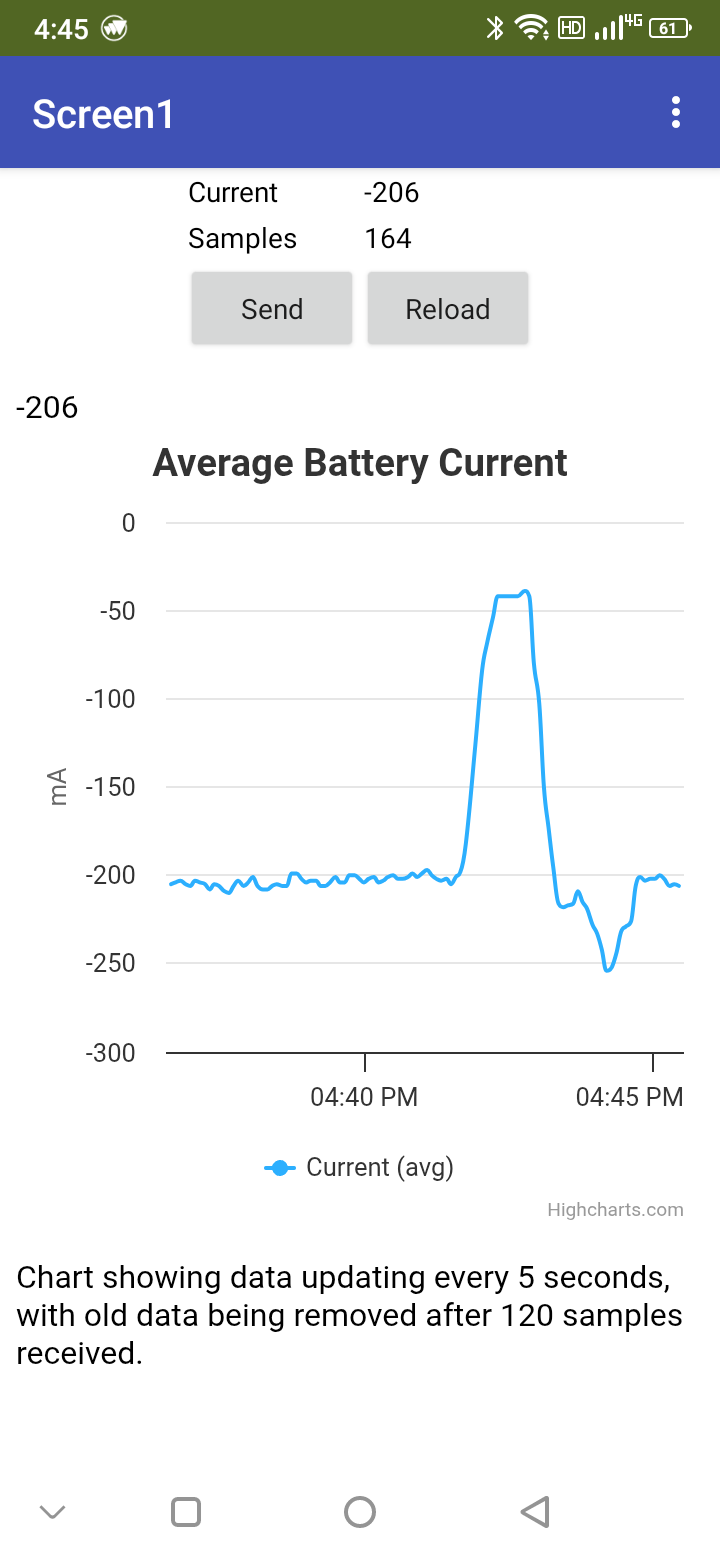
highcharts01.aia (124.4 KB)
Simple demo app to graph a single variable using highcharts.
Values are passed via webviewstring.
Home page and javascript stored locally on device
highcharts01.aia (124.4 KB)
As an alternative to the built-in chart component or google charts, highcharts doesn't get as much credit on here as it deserves ![]() Someone (that will probably be me)
Someone (that will probably be me) ![]() should do a full guide on its usage.
should do a full guide on its usage.
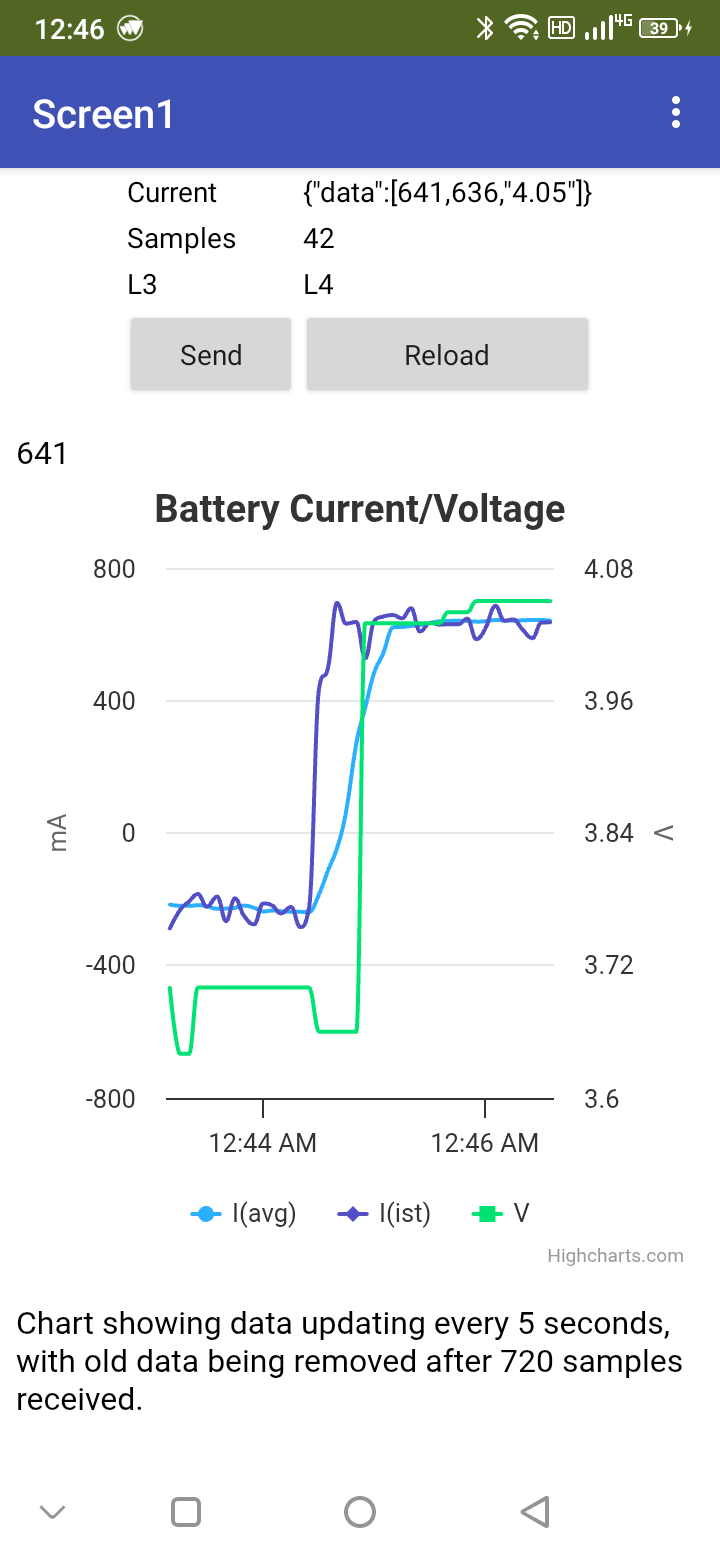
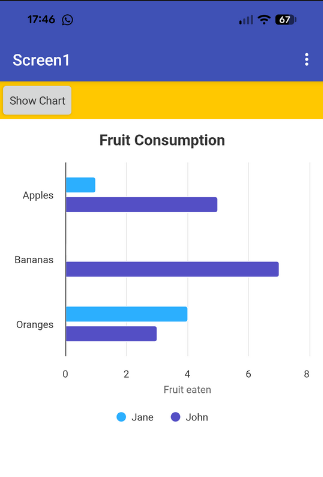
Agreed, highcharts is a great and powerful tool: changing only a few parameters to have a multiaxes, multiseries graph ( by the way my phone charger is not that good.. but it works ; - )
highcharts01_3_series.aia (125.6 KB)
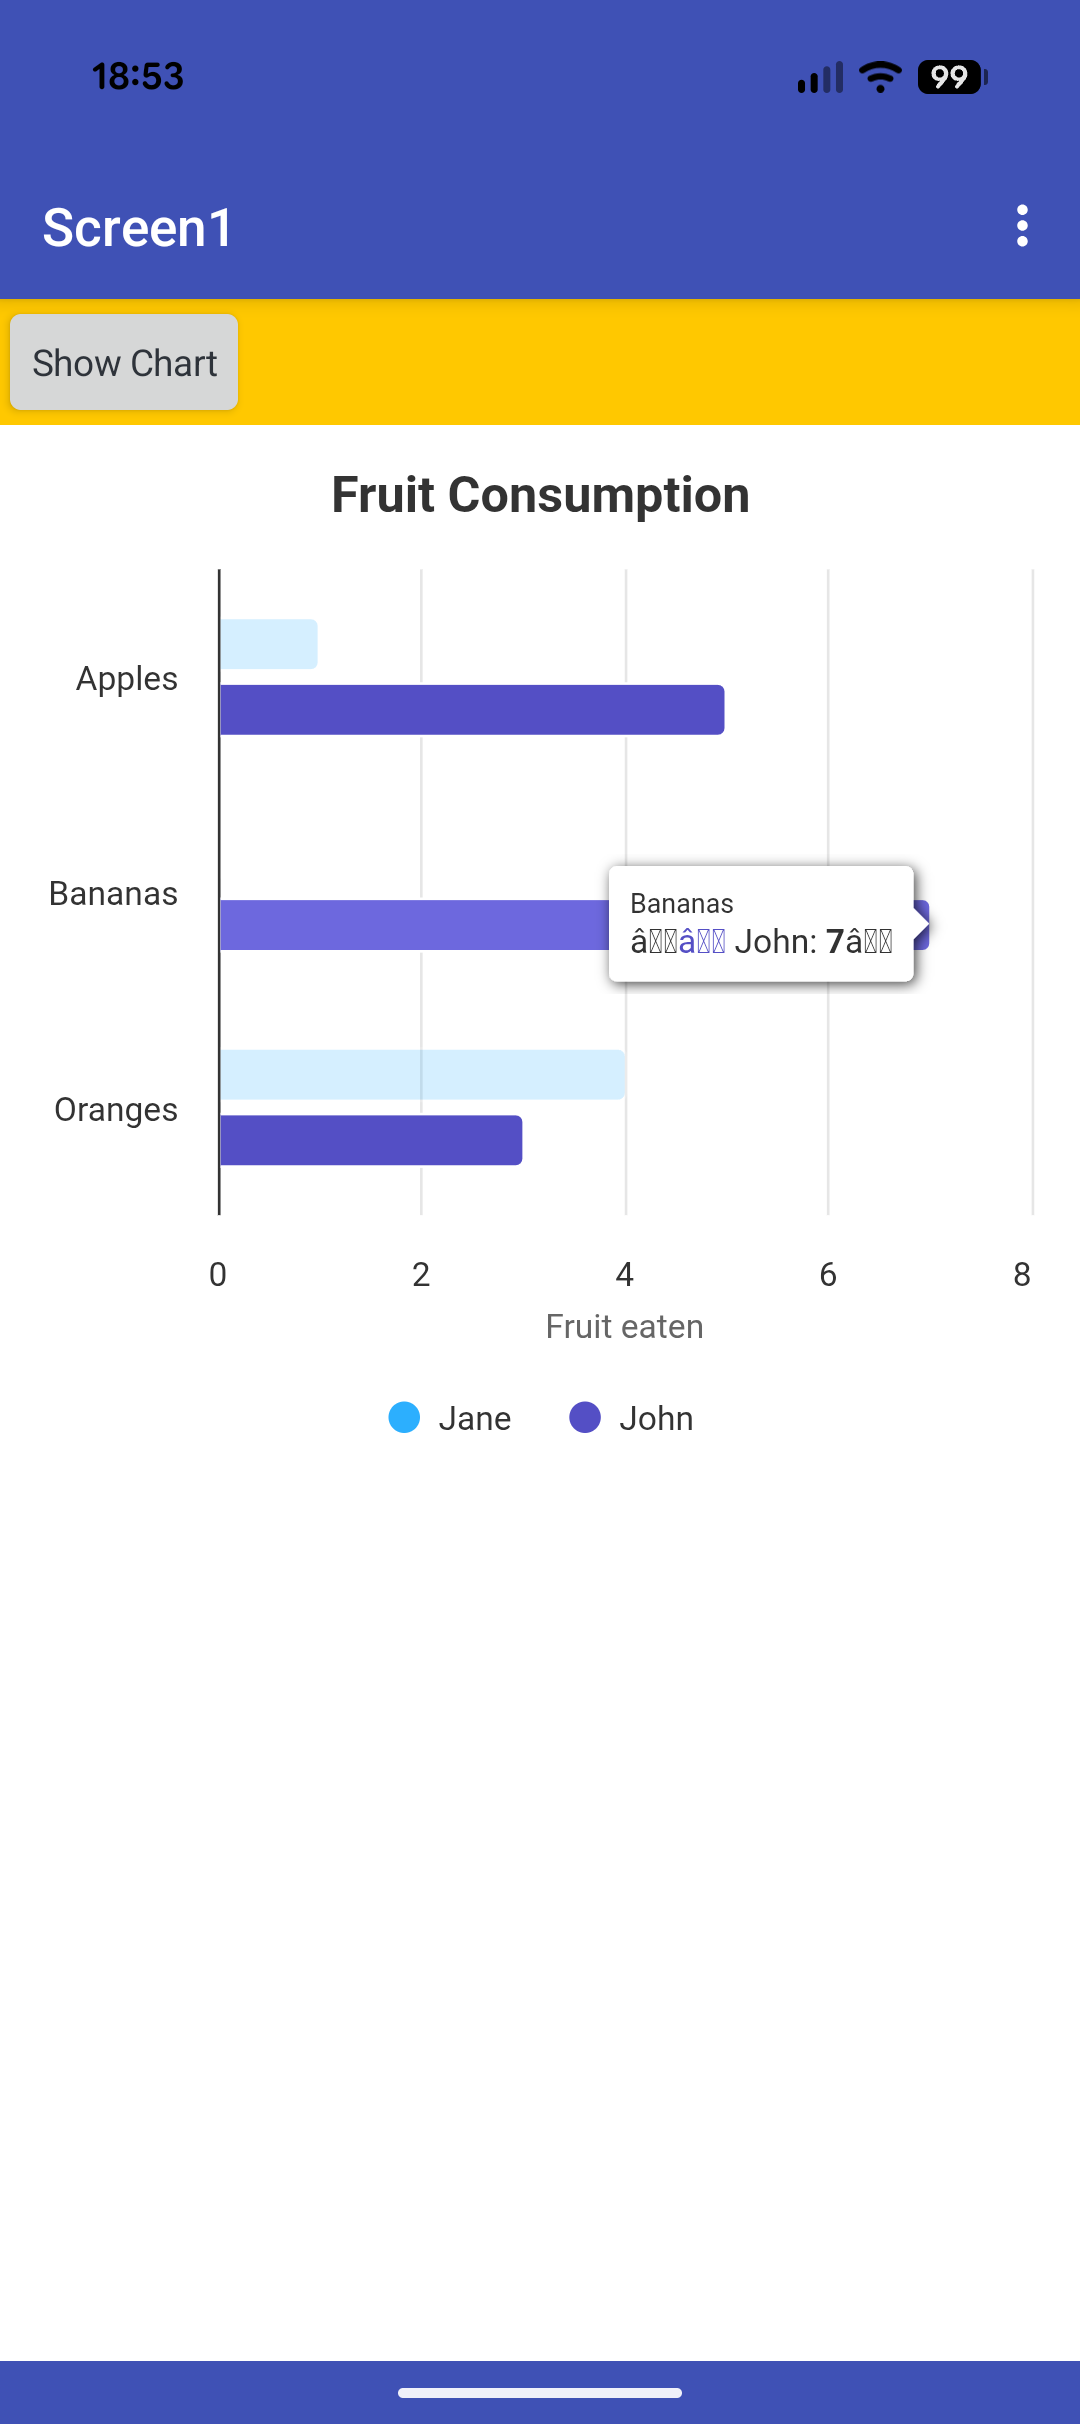
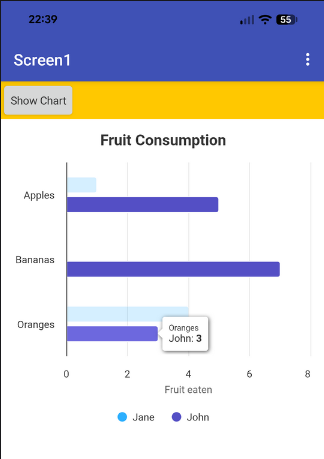
Herewith, the very basic functionality of Highcharts in an extension, no passing of data, just displaying a simple bar chart.
testHighChartExtn.aia (108.9 KB)
(The extension is "big" because it contains the highcharts.js file, which is 273kB !)
You can remove the credit (bottom right of chart) with this option:
    credits: {
        enabled: false
    },
Early days, I have just scratched the surface ![]()
[EDIT] in testing have now fixed the strange characters! aia provided above is now updated.
If I'm not wrong, for personal/non profit use, the credit attribution is required
P.S.
Forgot to add that I had to specify the container height explicitely, setting to automatic of fill parent, the graph was not displayed immediately, but only after rotating the phone ( not sure if this is a problem with my device )
P.P.S.
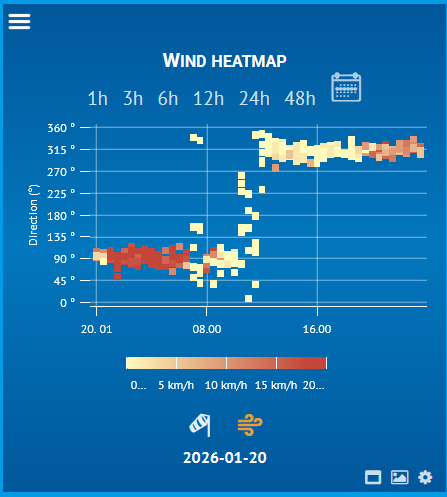
I like the heatmaps a lot ( this is a block for 'meteotemplate' )
P.P.P.S.
Also found that the 'customwebviewer' is able to return the javascript console ( which is useful in debugging )
You can always provide that somewhere else, if you do not want it on the chart itself.
I also note that dependent on use, a commercial licence may be required.
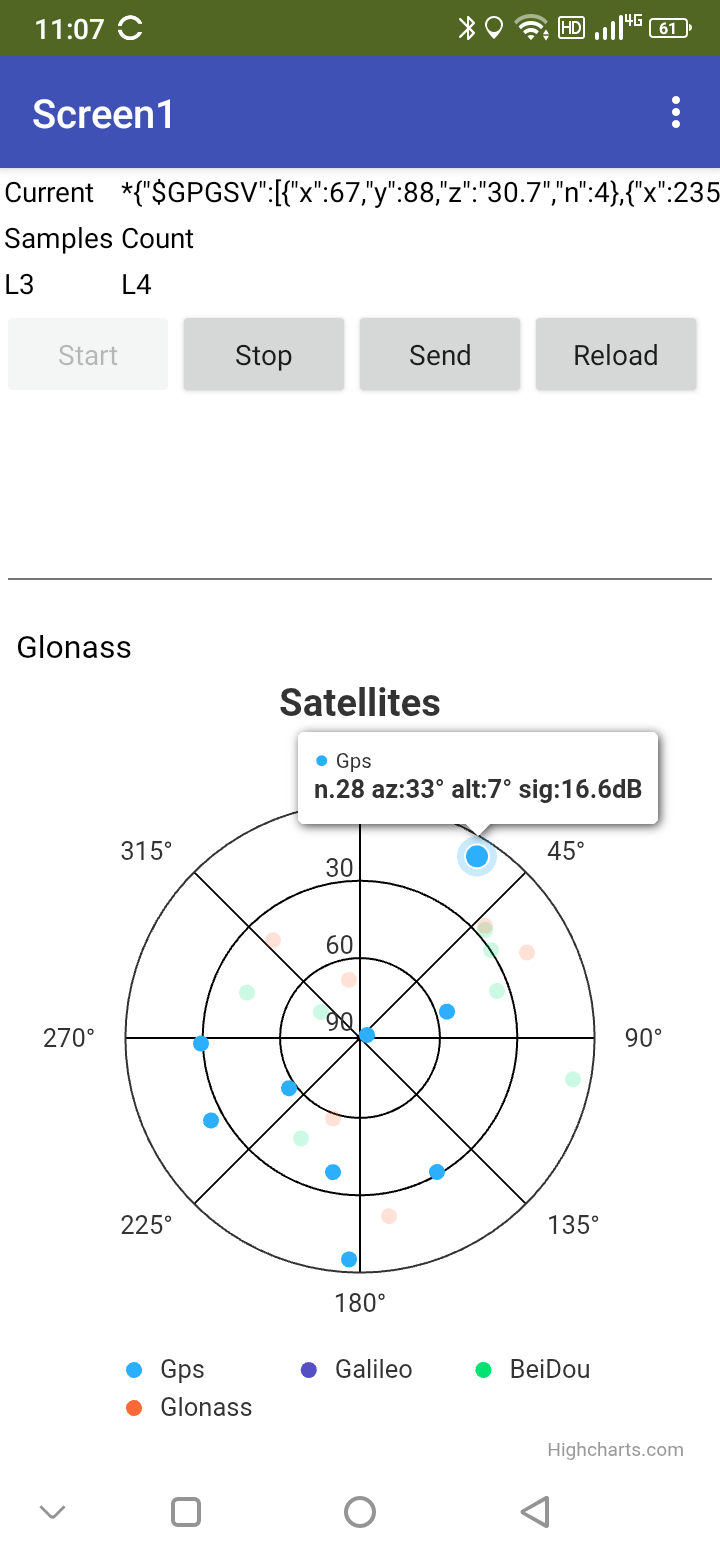
This is a realtime demo, a polar chart of positioning satellites received.
It uses the nmea sentences extension of @Juan_Antonio and the custmwebview of @vknow360 to access javascript console.
Three Polar plots examples made in June 2023 using NMEA ephemeris data
and one in April 2023
for those exploring NMEA ephemeris data. No extension was available at that time so made my own polar plot. Thanks for showing the usage with Highcharts @davidefa . ![]()