Graphing data received via Bluetooth from Arduino not graphing what I was expecting(?)

Here is your original Clock1.Timer:

Here is my revised version:

What I changed:

  • ripped out that BT Read Unsigned Bytes (bytes are in range 0-255, so you were graphing the ASCII codes of the digits in your reading, one by one)
  • read your blocks (it's a nasty job, but SOMEONE has to do it)
  • renamed that X_before to X_before_increment, to better understand it (before WHAT?)
  • brought the before logic together with the boundary test

What I did NOT do:

  • fit the expected Y values into the range 1-Canvas1.Height

All blocks are draggable into the Blocks Editor

2 Likes

Thank you ABG, I appreciate the help. I apologise if I've come across as senseless.

I understand what you've done and the silly mistake I made myself.

Hopefully I can finish it without any more problems.

Cai

If you have any more problems, you can ask :slight_smile:

1 Like

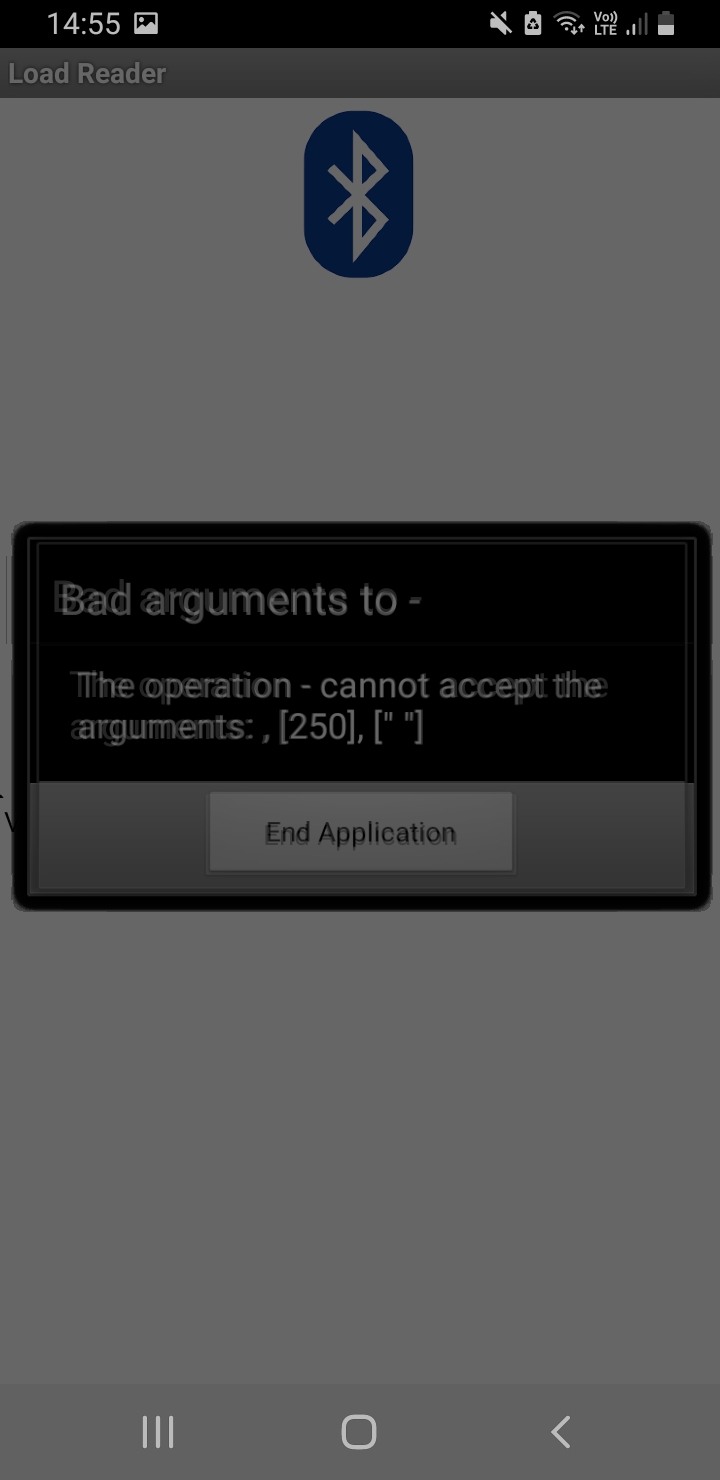
I made the changes and started receiving a similar error (photo attached, blurry and dark as it is refreshing similar to the last error, 250 stayed the same and nothing was appearing in second bracket).

Made some changes myself (attempted to fit the expected Y values but nothing seemed change)

I changed the bps to 9600 instead of 115200 and the error disappeared but nothing is being graphed, with or without the changes I made. :thinking:

Please stop with the personal messages.

Any one on the board can answer these, and you go to the back of the line when you do that.

Export your .aia file and upload it here.
export_and_upload_aia

2 Likes

Apologies, I'll stop with the replies.

Here's the changes I made but I must admit I wasn't too sure what you meant by this, or why it was essential:

Here is my attempt at what I thought you meant but, still no luck.

Load_Read.aia (6.4 KB)

Been working on this since yesterday with no luck still. I was reading this piece from the FAQs, and tried a similar approach and attempted implementing the Bluetooth into it, with no luck and a similar error the one I had in my previous error. Except with nothing in the first set of brackets and a 0 in the second.

Returning to my original blocks, I removed the edits I made to the previous post I did as I realised it was wrong. Here is where I am at so far; I am not receiving an error, just nothing is appearing on the graph.

Load_Read.aia (6.3 KB)

Any help greatly appreciated.

Edit: Further reading took me to this edit of the piece from the FAQs. Attempting to modify it has given me an error which I believe is due to the fact the the app I download is not the updated version that I have done, as the error says the MAC address is incorrect. As I am deleting the blocks that contain the MAC address, I cant find why it would say that.

Still no closer in my own app to getting something graphed.

I'm very confused now. I don't see where my project is failing. I'm revisiting my initial arduino code, but it's sending the correct information.

What I've done in the blocks looks correct but Iit's still not working and beginning to annoy me! :joy:

  • fit the expected Y values into the range 1-Canvas1.Height

I believe it has something to do with this but I'm not entirely sure what this means.

I'd like to get this to work when uploading my sketch OTA after I've finished, but I'd like to get this finished first :slight_smile:

.aia file is in my previous post

Here is a version of the .aia that allows you to enter Y values from a text box, to verify that the graphing part works.

I tested it on my phone, and got a graph started, though I had to press Enter too many times for reaching the end of the x axis to see wraparound.
when  btnEnterY .Click do


Load_Read_ABG.aia (6.8 KB)

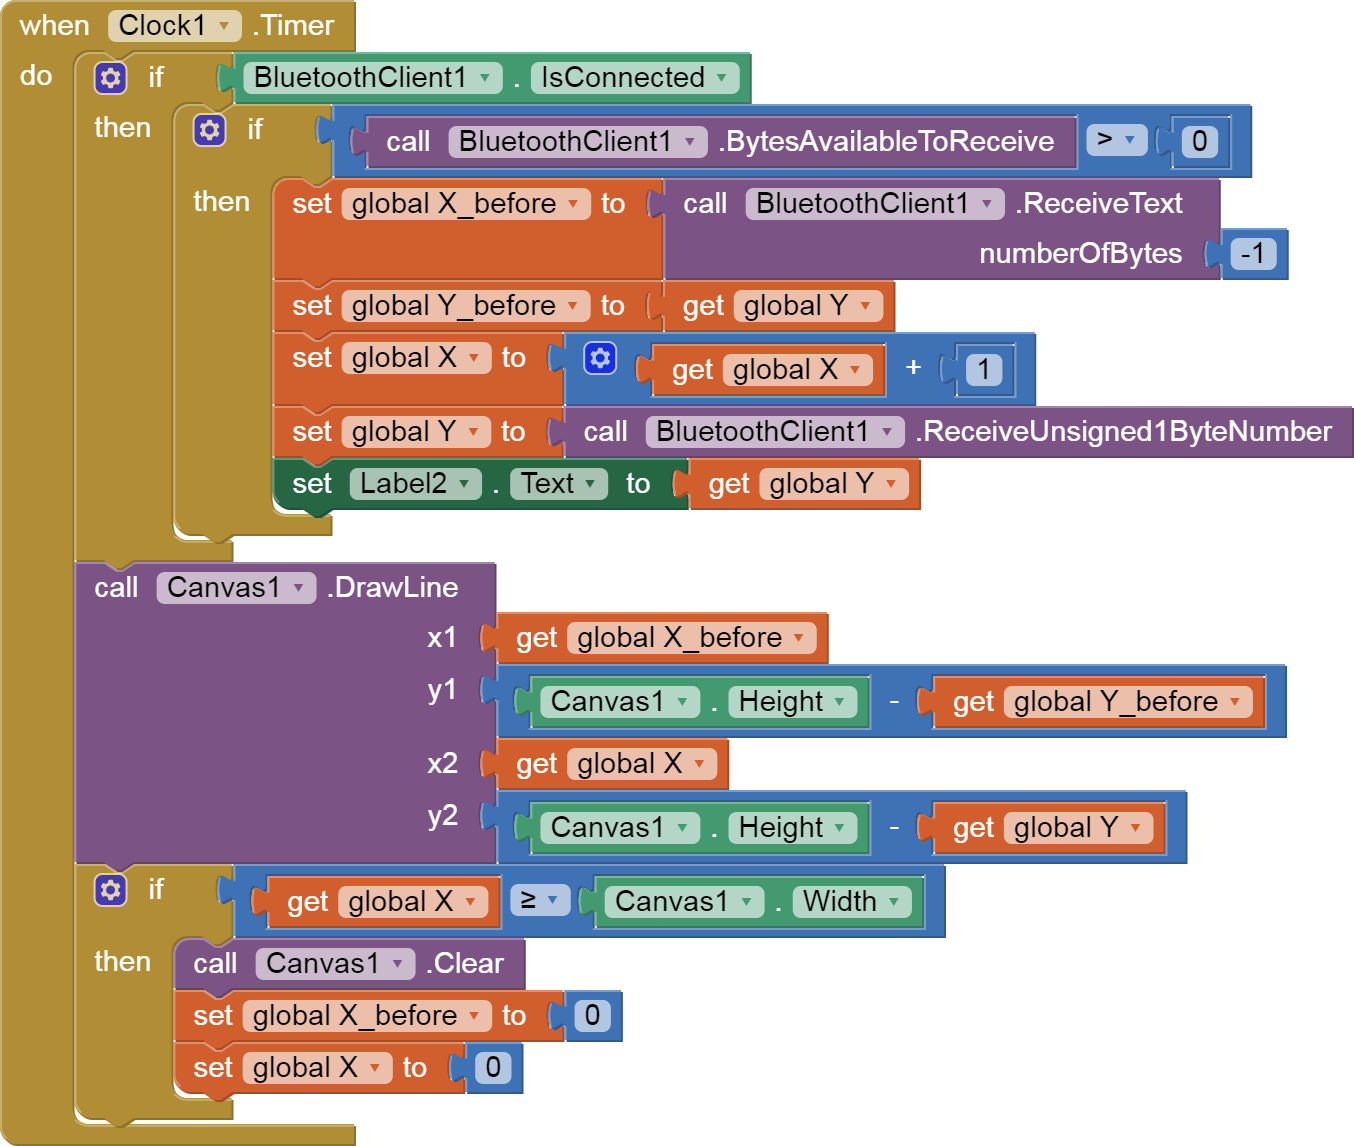
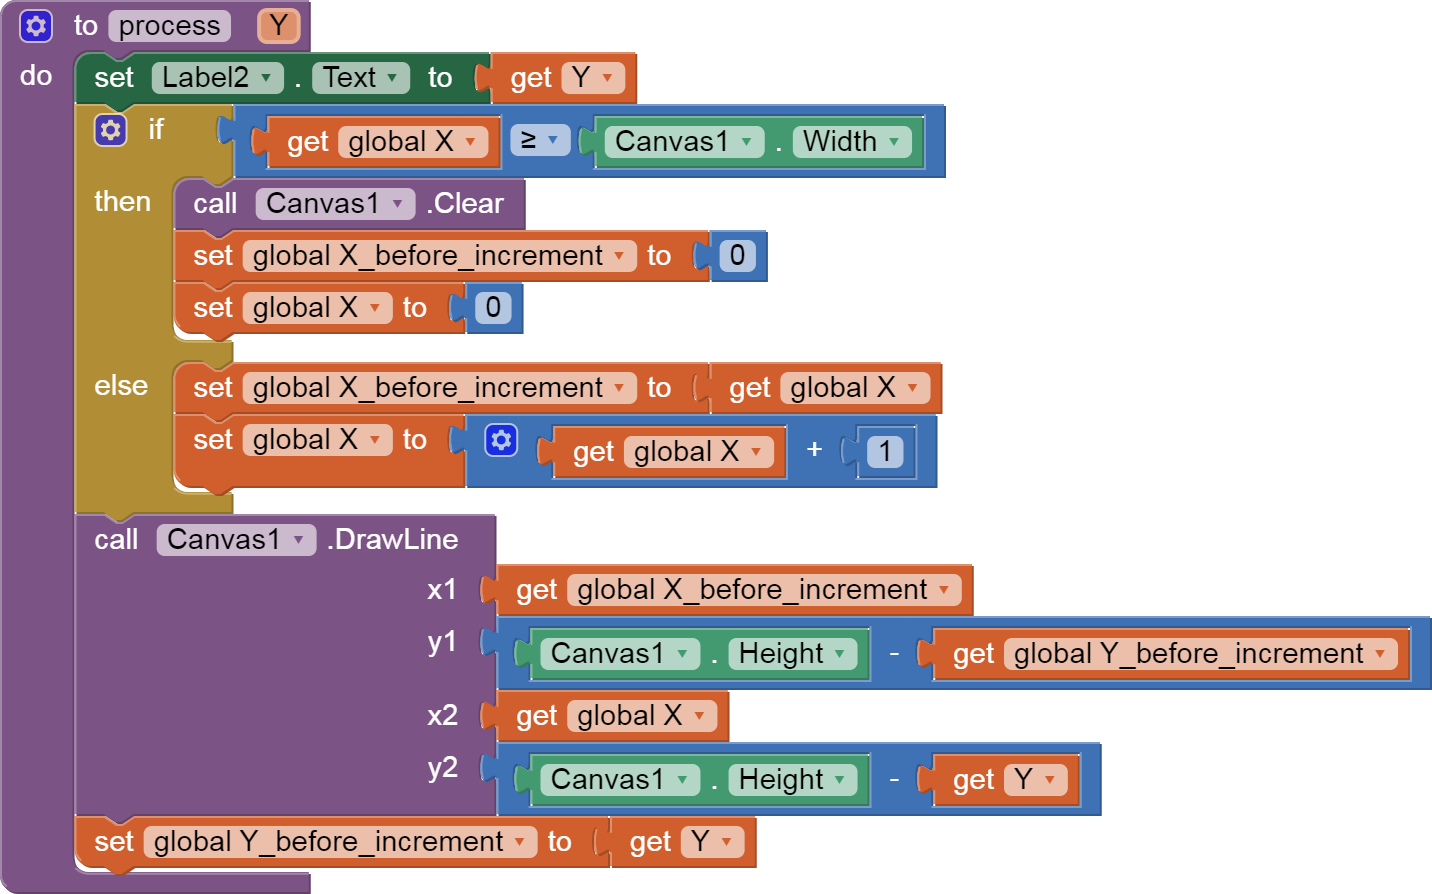
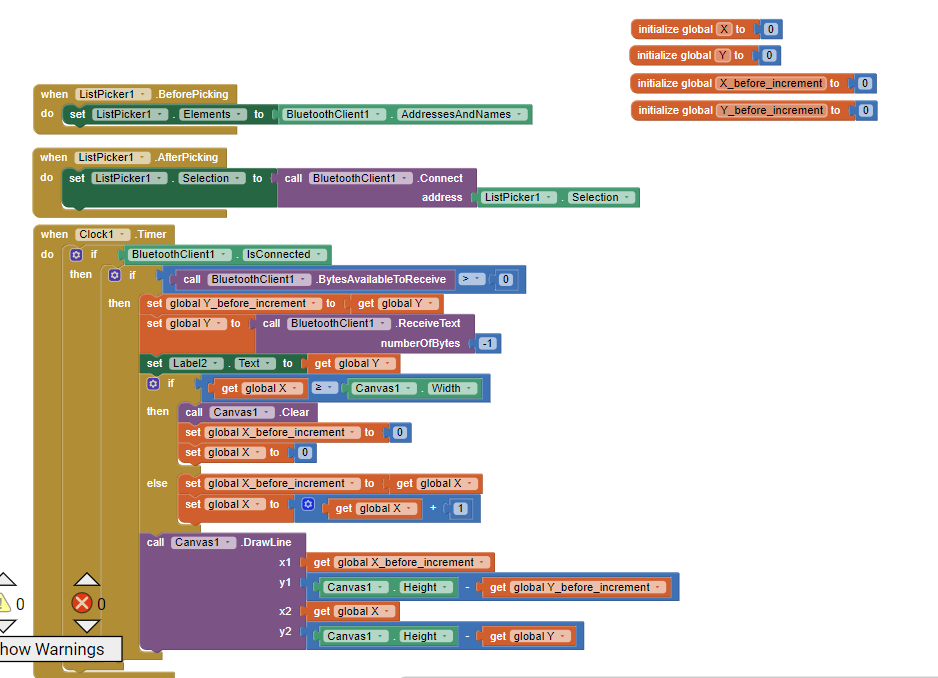
Ahh I see. Yes the graphing works. But I can't figure out how to graph what is being received via Bluetooth instead. I see you have added the 'to process Y' block but I can't find out how to add that to my own as it doesn't show in my own Procedures block section.

Edit: And I see the extra Y_before_increment to get Y after the canvas draw bit, but not sure why that's there too. I added it with no difference to outcome. So the only difference I can see is that there's something with the fact that it doesn't recognise the received data as graphable but the data inputted manually can be? I'm very confused haha :sweat_smile:

Did you notice how small my Clock1.Timer event got?

Its guts moved into the process procedure,
and were replaced with a call to that process procedure sending it the recently arrived BlueTooth value.

There is a chapter on procedures in the free book at
http://www.appinventor.org/book2
from

I see, I can appreciate how it shortens then loop visually.

I don't understand why you need the Bluetooth if your just going to type the values in anyway.

This was for debugging purposes only.

It's like when you open up some electronics and see extra pins and connectors on the circuit board, to give the repair technician (do they still exist?) a place where they can test voltages or inject signals, to see which parts of the board are working and which are not working.

This is a special case of the more general debugging technique called Divide and Conquer, where you try to divide a complex problem into smaller, simpler problems.

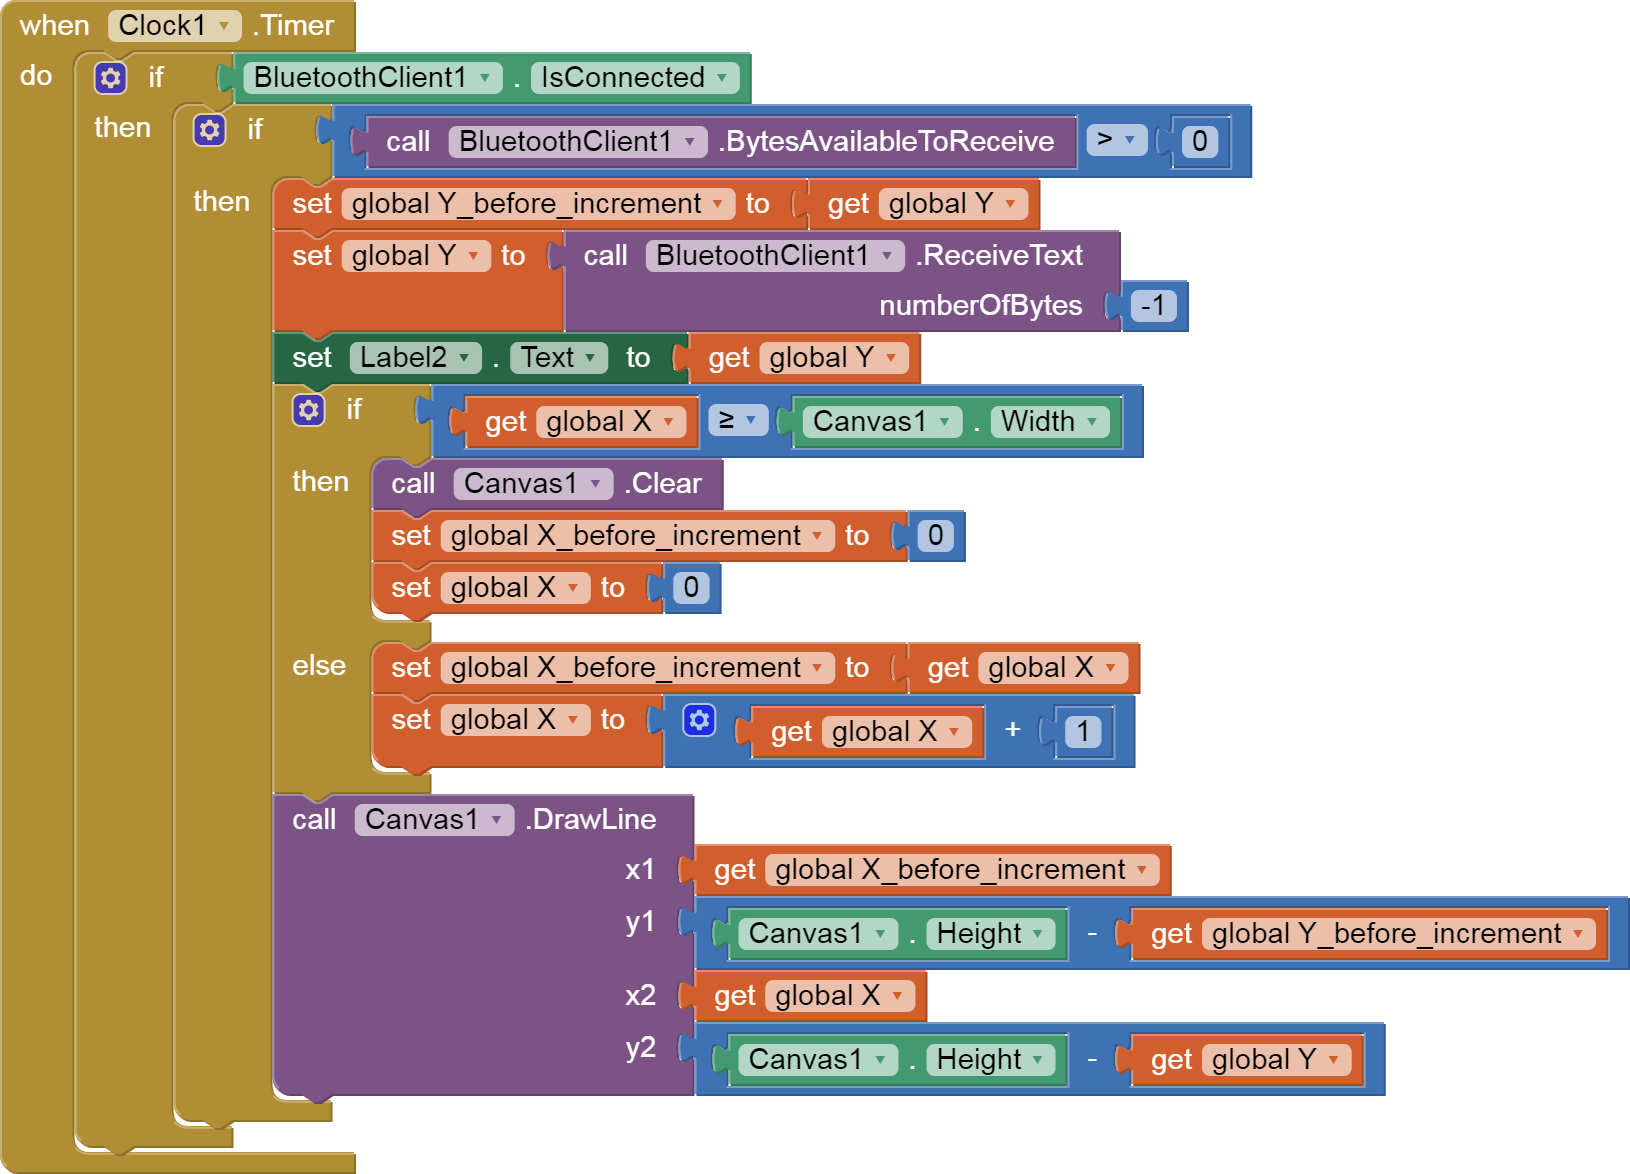
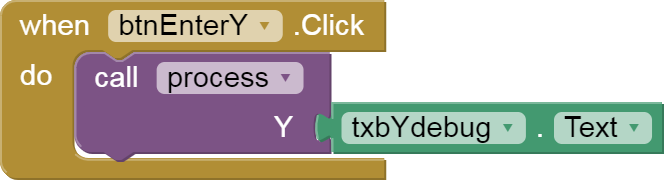
Here; I added the process procedure to separate two different questions:

  • Is the Bluetooth part receiving data at all?
  • Is the graphing part capable of receiving successive Y values and graphing them?

Once we are satisfied with the process procedure, we can make the Horizontal Arrangement holding that text box and Enter button inVisible, so they are there in case we might need them later.

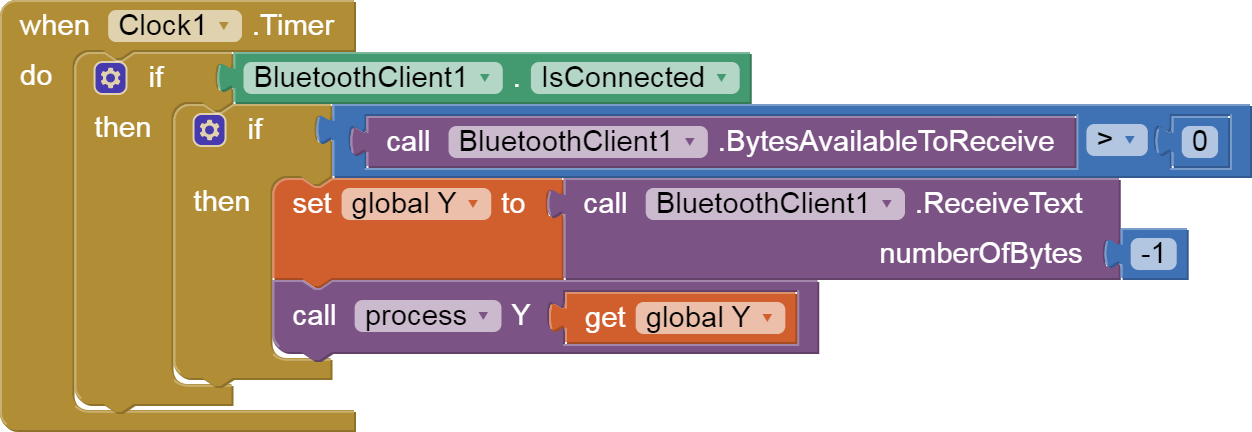
Ahh OK I'm following. I'm aware of Divide and Conquer and just couldn't figure a way of reducing this problem down. So the graph can be plotted as it is definitely receiving data via Bluetooth. But when trying to plot said data it does not. Struggling to figure out why.

I've had some time away from this project, I'll return soon but I forgot to bring the device on my trip so I'll have to wait a little longer then I had hoped.

Use:
("ISO-8859-1")

rather than

("UTF8")

...and how would that be useful?

because they are in UTF8 the ASCII range of 0..127.

Bigger than that bytes/characters are outside ASCII range, and UTF-8 is encoding them as two bytes, ie:

Unicode character 224 is encoded in UTF-8 as 195 160

1 Like

thank you so much. I followed this revised for my set up and graph run in real time.
But I dont understand well why Canvas1.height - global Y because I searched canvas coordinate system in MIT and compared. I am confused that step.
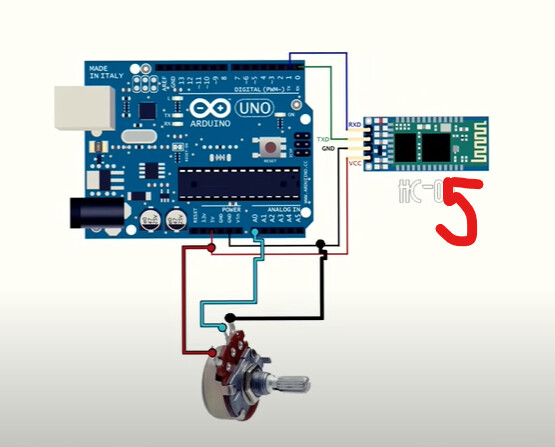
image

image
int in = A0;
Arduino code
void setup() {
// put your setup code here, to run once:
Serial.begin(9600);
pinMode(in, INPUT);
}

void loop() {
//put your main code here, to run repeatedly:
float val = analogRead(in);
float val2 = val / 205*100;
Serial.println(val2);

delay(400);
}

The AI2 Canvas Y coordinate is reversed from people's usual expectations of the direction of Y.

In math class graphs, the origin (0,0) is in the lower left corner, with y extending upwards.

In the Canvas, the (0,0) origin is in the upper left, with Y extending downwards.

That's why to make a math class style graph, you need to flip the sign of the Y and pull it up to fit the height.

P.S. AI2 now has a graph component that can accept Bluetooth input directly.

P.P.S. I searched for why the origin is at the upper left for Canvases, and found:
canvas - Why are graphics coordinates measured from the upper left? - Stack Overflow.

Thank you so much. Based on your share, I thought and understood well about this problem. Respect !!!