Hello friends, I want to draw graphs with the data I have taken from google sheets. Although I pull the data, it gives an argument error while drawing the graph. Where am I doing wrong, can anyone help? Thank you from now.
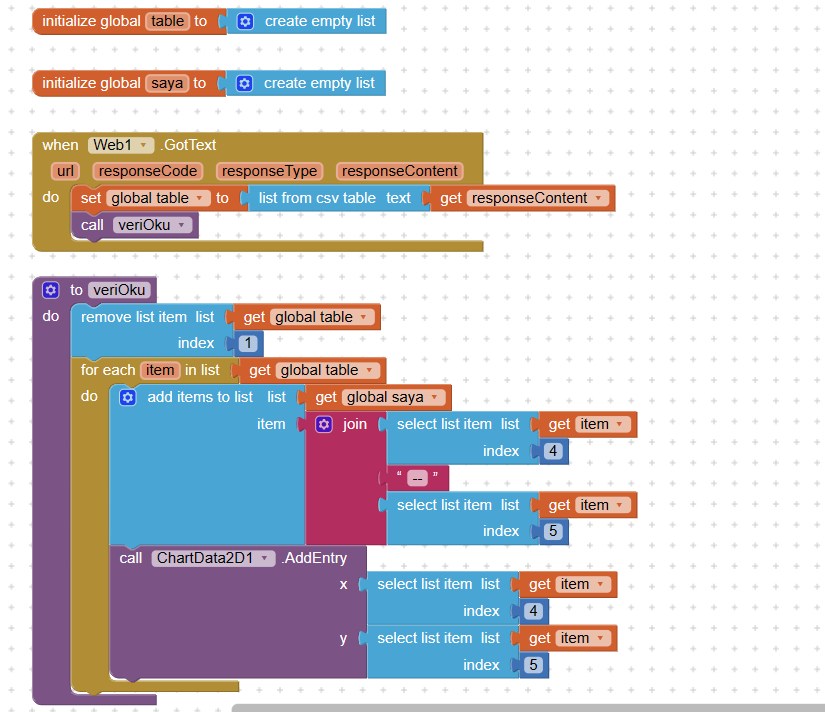
Please show the data coming back in responseContent
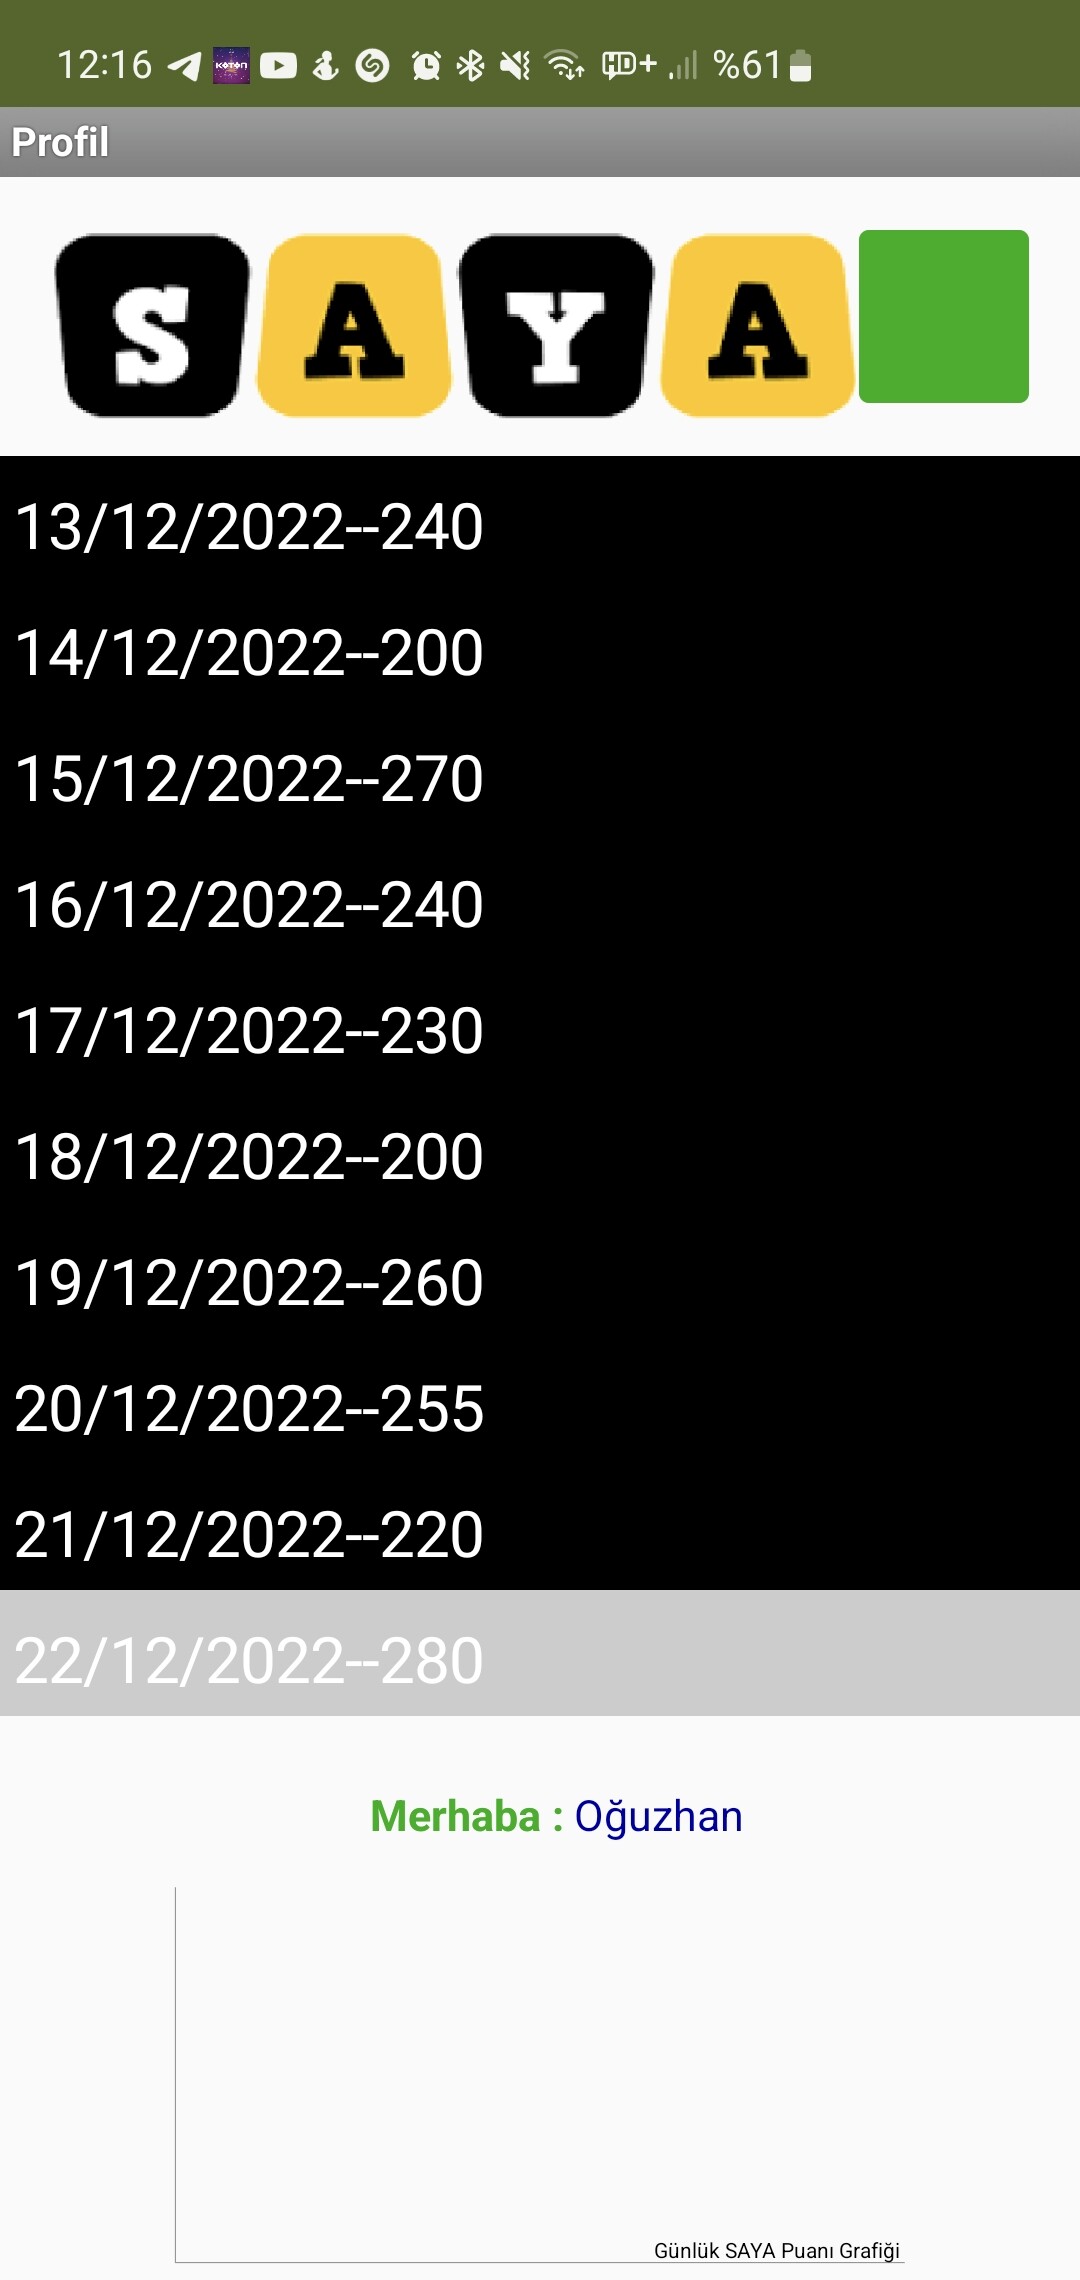
I put the incoming data in a listview. But i want to draw a graph. In the form of this score on this date.
Looks like you need to split each list item at the hyphen - ,then apply the data to the graph.
1 Like
The Chart component is special. You can only assign numbers to a graph. Even if you split it at hyphen, you will also have to split it at the slash (/)...
2 Likes
Pull in the Clock component from the Sensors Drawer in the Designer.
It has block to do date math and date conversion.
1 Like
You might also want to reverse the date format from 25/12/2022 >> 20221225 .....
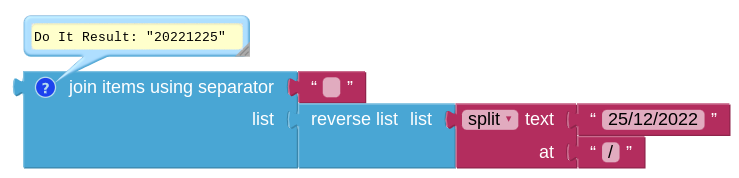
(you could always set this as a custom date format in your google sheet)
1 Like
I did a few tests and it seems that the Chart component crashes if the number in the x axis is too large, in this instance, 20M. You may have to use another way to create a chart, maybe this extension?
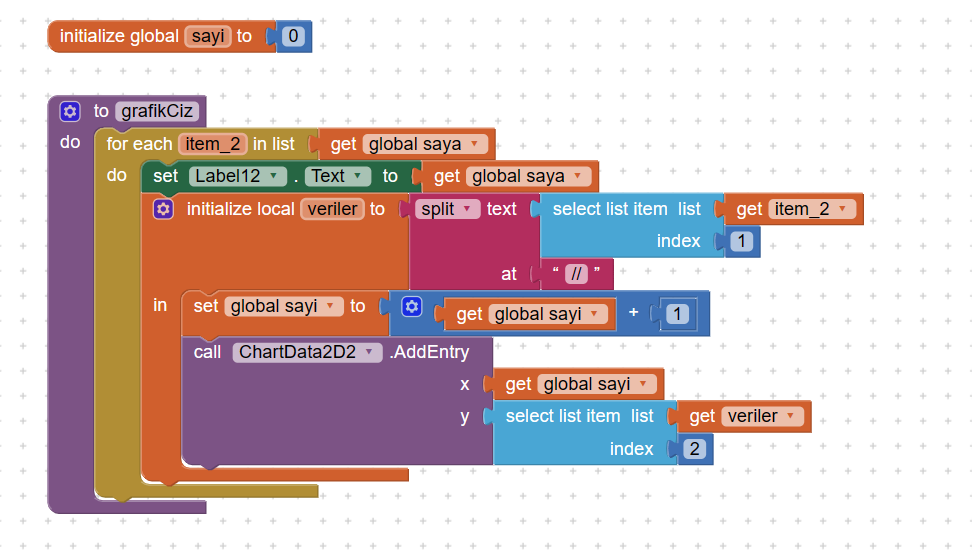
Theoretically this AIA should work. I made some modifications on the procedure grafikCiz in the Profil screen. If you reverse the x and y values a chart appears, if you keep it there the app crashes.
SAYA_1.aia (397.5 KB)
1 Like
The x axis only needs to run from 1 to 7.
There is one reading per day.
Use the starting and ending days in Labels outside the graph.
1 Like
I guess I couldn't do that part, let me check again. I will do it with split right?
actually i get the date information from google form. I want to create a graph of points earned and saved in google forms every day. can this component work for me?
I'm trying this, I'm trying to do a simple project for middle school students, the data can be between 8-10 maximum
Should I print scores on the y-axis as 1,2,3... instead of dates on the x-axis?
You can make the x axis like day 1, 2, 3...and specify the date of date 1 in a label.
