Hello, I want to make a graph for a thermometer, but something doesn’t work out. I looked at the forms and can’t figure out what the error is.
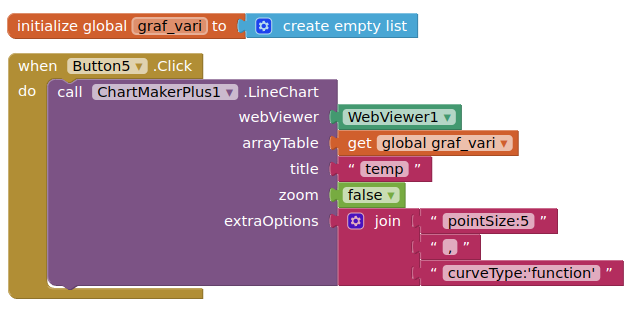
I used the extension:chart maker plus
If anyone can help I would be glad
BT_Term_V1_1.aia (238.2 KB)
Hello, I want to make a graph for a thermometer, but something doesn’t work out. I looked at the forms and can’t figure out what the error is.
I used the extension:chart maker plus
If anyone can help I would be glad
BT_Term_V1_1.aia (238.2 KB)
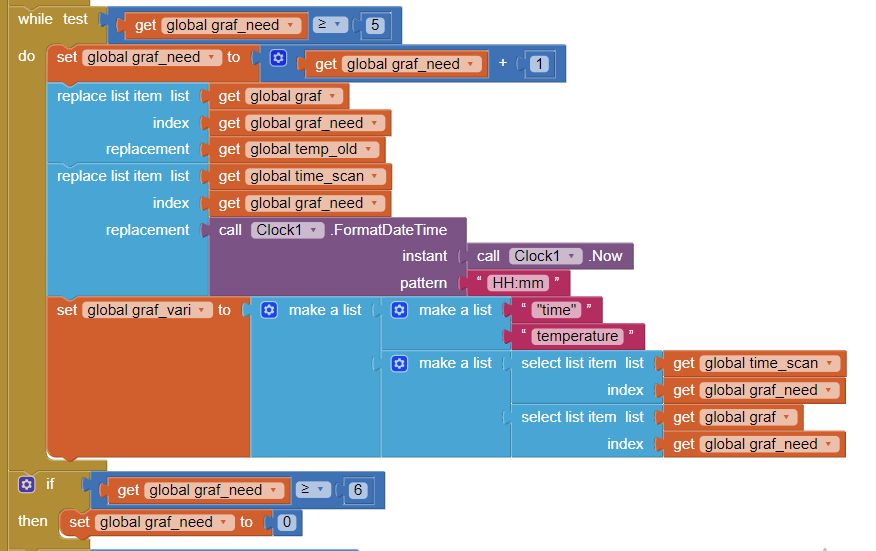
I transfer the values to the phone via bluetooth and after receiving, I make numbers from the symbols
Please show some example data, so I can see why the graph may not be displaying....
OK, if you do not want to show me the data, I cannot help you further....
I’ll tell you what’s coming to your phone, right?
example: 1. 39.9, 15:45(time); 2. 36.6,16:00; 3. 37, 16:30; 4. 37.2, 16:45
Thank you.
Your "arrayTable" (AI2 list) will need to look like this:
[
["Time","Temp"],
["15:45",39.9],
["16:00",36.6],
["16:30",37],
["16:45",37.2]
]