I am using the graphiccart extension, I wanted it to draw a graphic according to the data on google sheet, but although there is no warning on the application screen, it does not draw the graphic.I am not knowledgeable about this at all. I don't even know if I did it right. I would be glad if you help.
Hello Özge
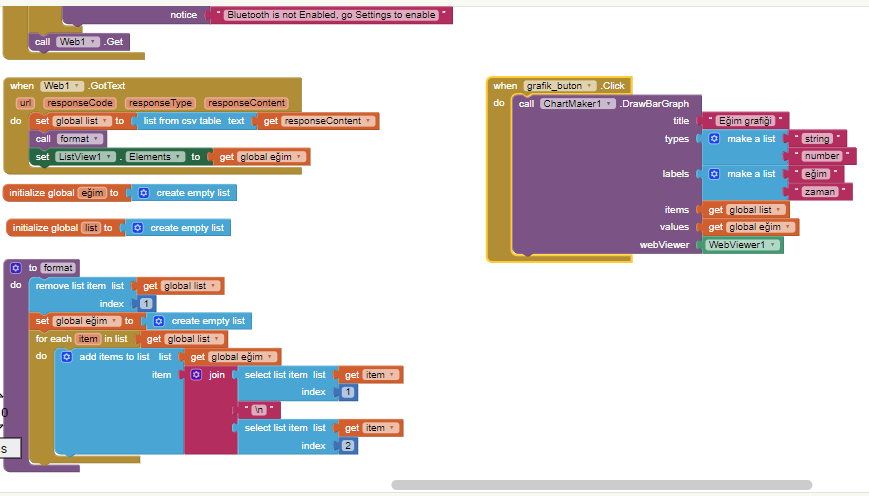
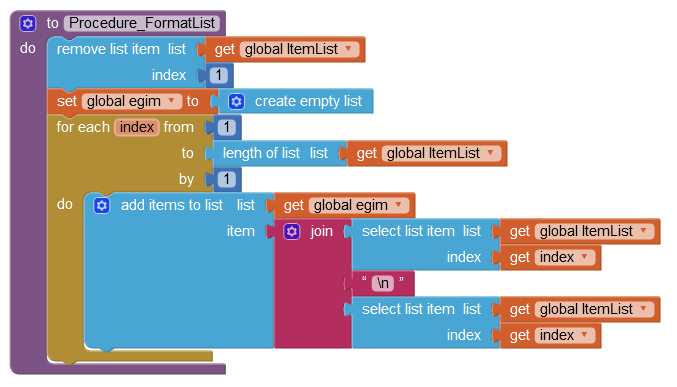
Your 'format' procedure is wonky, that might have something to do with the failure - we can't see all the Blocks though.
Try this (note, your variable/procedure naming - give them a meaningful name and ensure that if that is a single word (not recommended)) , it does not use underlying Keywords.
https://www.professorcad.co.uk/appinventorjavakeywords Java and Scheme Keywords
basbelas_chart.aia (1.8 MB)
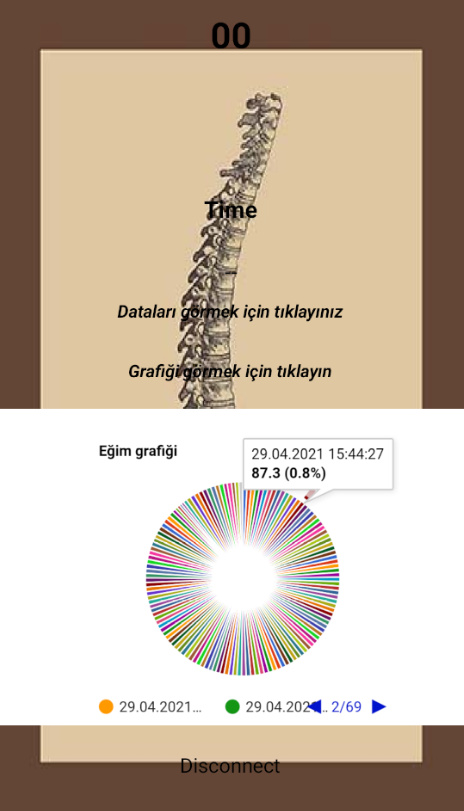
This is my application, the application receives the inclination data with bluetooth, first shows it on the screen and then saves this data to google seete from here it prints it in the application.
Everything works smoothly up to here, but I want to draw a graph with this instant data. This part does not work.
This is a continuation from here:
You cannot make this chart:
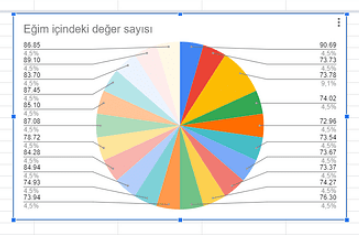
with the Chartmaker extension.
Are you happy with a bar chart ?
Yes, I looked at the links you posted on the topic I opened before and saw that I could not really draw such a graphic. now i'm just trying to do any graphics with charmaker extension no matter which one but it doesn't work.
Draw a pie chart like this:
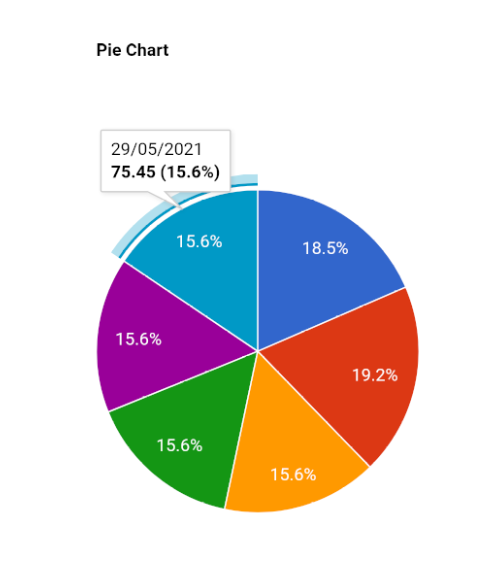
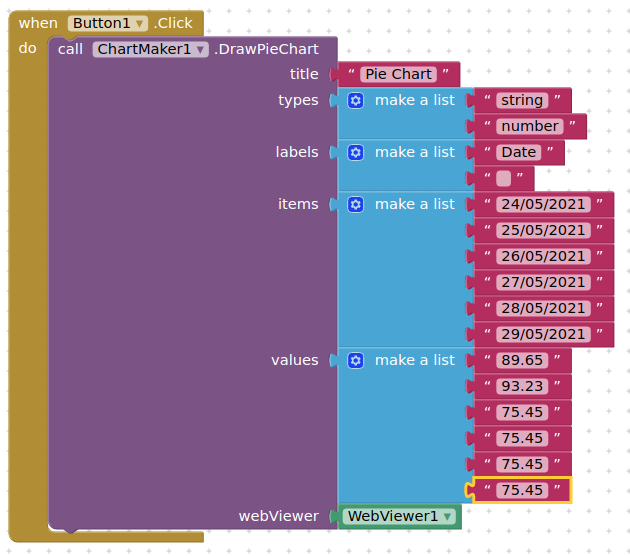
You have to split up your data to a list of dates and a list of values for the "items" and "values" in the blocks
Can this graph be automatically plotted according to the data on google sheet?
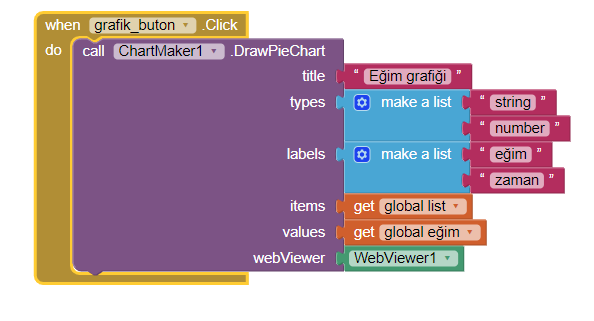
I guess you entered the date and slope values manually here
Yes, if you call back your data from the google sheet, then create two lists, one of dates (type string) and one of values (type number), then feed in those two lists to items and values.
1 Like
I plotted the slope values from the list, but it doesn't work. where is the problem i can't see
This makes a pie chart
Check your lists, did you remove the headers?
Show contents of lists here, if that helps...
basbelas_chart (1).aia (1.8 MB)
Please look, because my English is bad, I cannot express it completely. My application works fine, it just doesn't draw graphics. Maybe if you examine the code blocks, you will see what I mean.
It is very pretty, but perhaps not very helpful ?
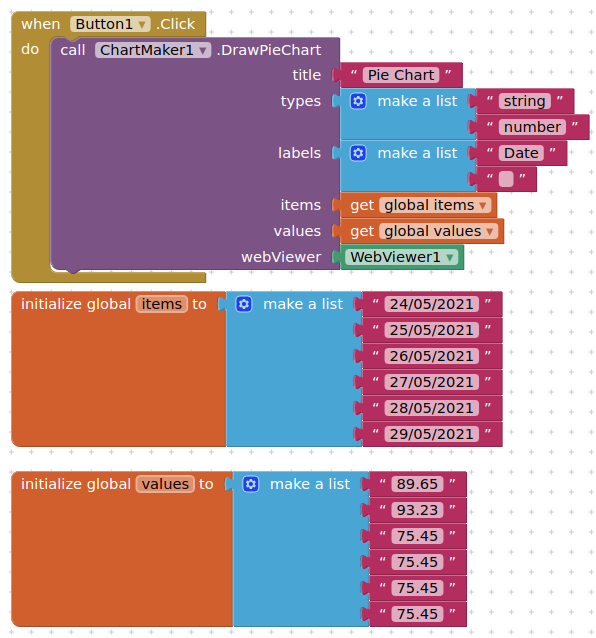
See attached revised aia project. I added a couple of variables, and set the items and values for the lists. Also reorganised your blocks a bit so that things work.
basbelas_chart1_revised.aia (1.8 MB)
It looks really great, but do I have a separate setting? I still do not see the graphic when I click the button.
Try this one
basbelas_chart1_revised2.aia (1.8 MB)
I put the webviewer in a separate arrangement and then hide/show as required.
the problem is fixed. so how did you do it can you explain briefly so that everyone can learn
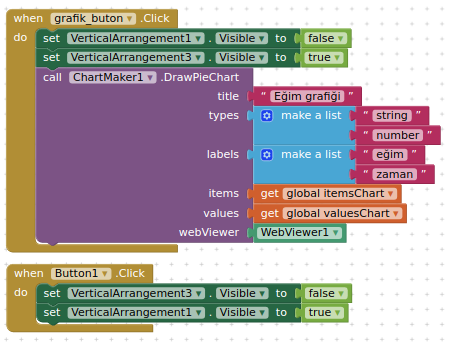
- Put Webviewer (and a button) in separate arrangement. Then make this not visible.
- Add visibility blocks to the graphiks button to hide the main view and show the webviewer
- The return button takes the user back to the main view
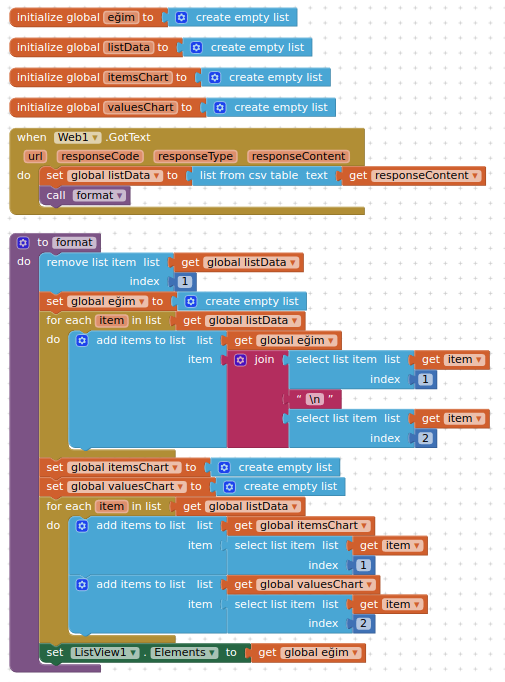
To get the items and values, working from your existing blocks, I added two list variables. Then using your downloaded list (with first item removed), i iterated over the global listData and assignefd the value in index 1 for each item to global items, and the value from index 2 to global values. These two lists are then set in the chartmaker blocks (as you see above)
1 Like
thank you so much for everything :kalp:
This topic was automatically closed 7 days after the last reply. New replies are no longer allowed.