Hey,
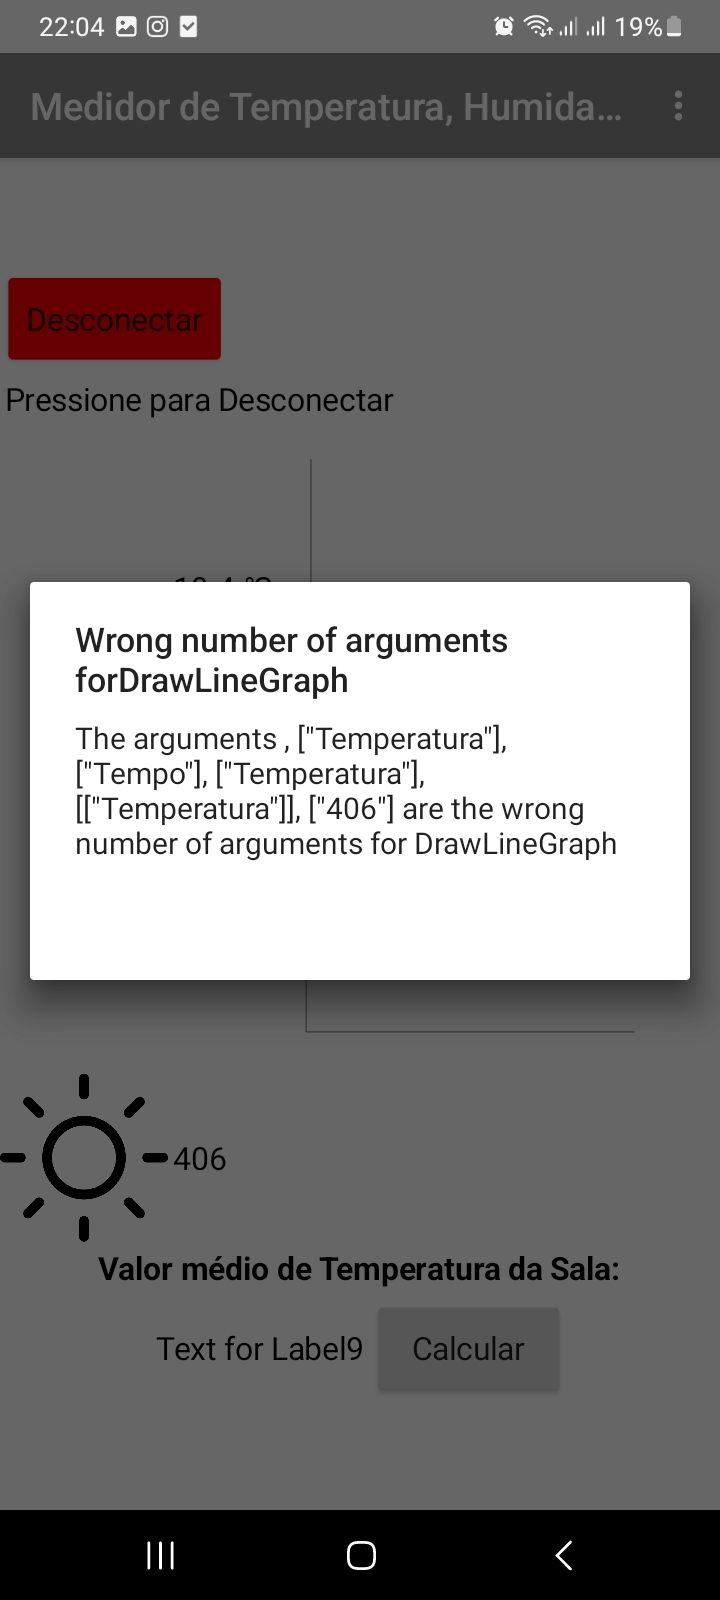
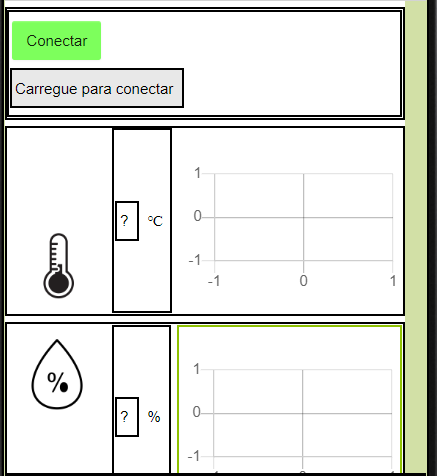
I'm new in this software, and i'm doing a app to show the values of temperature, humidity and luminosity. I get the values from a dht11 sensor and these values are published in MQTT Explorer. I have the extension to get the values, but i'm having trouble in the graph building. In attachment i have my layout, blocks, and error message.
Thanks for your help and a happy new year!