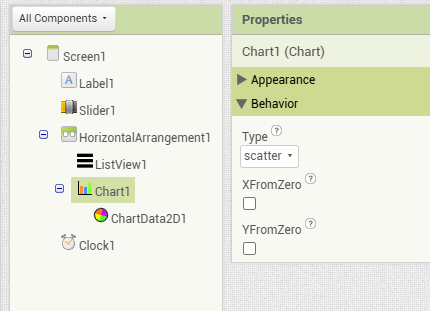
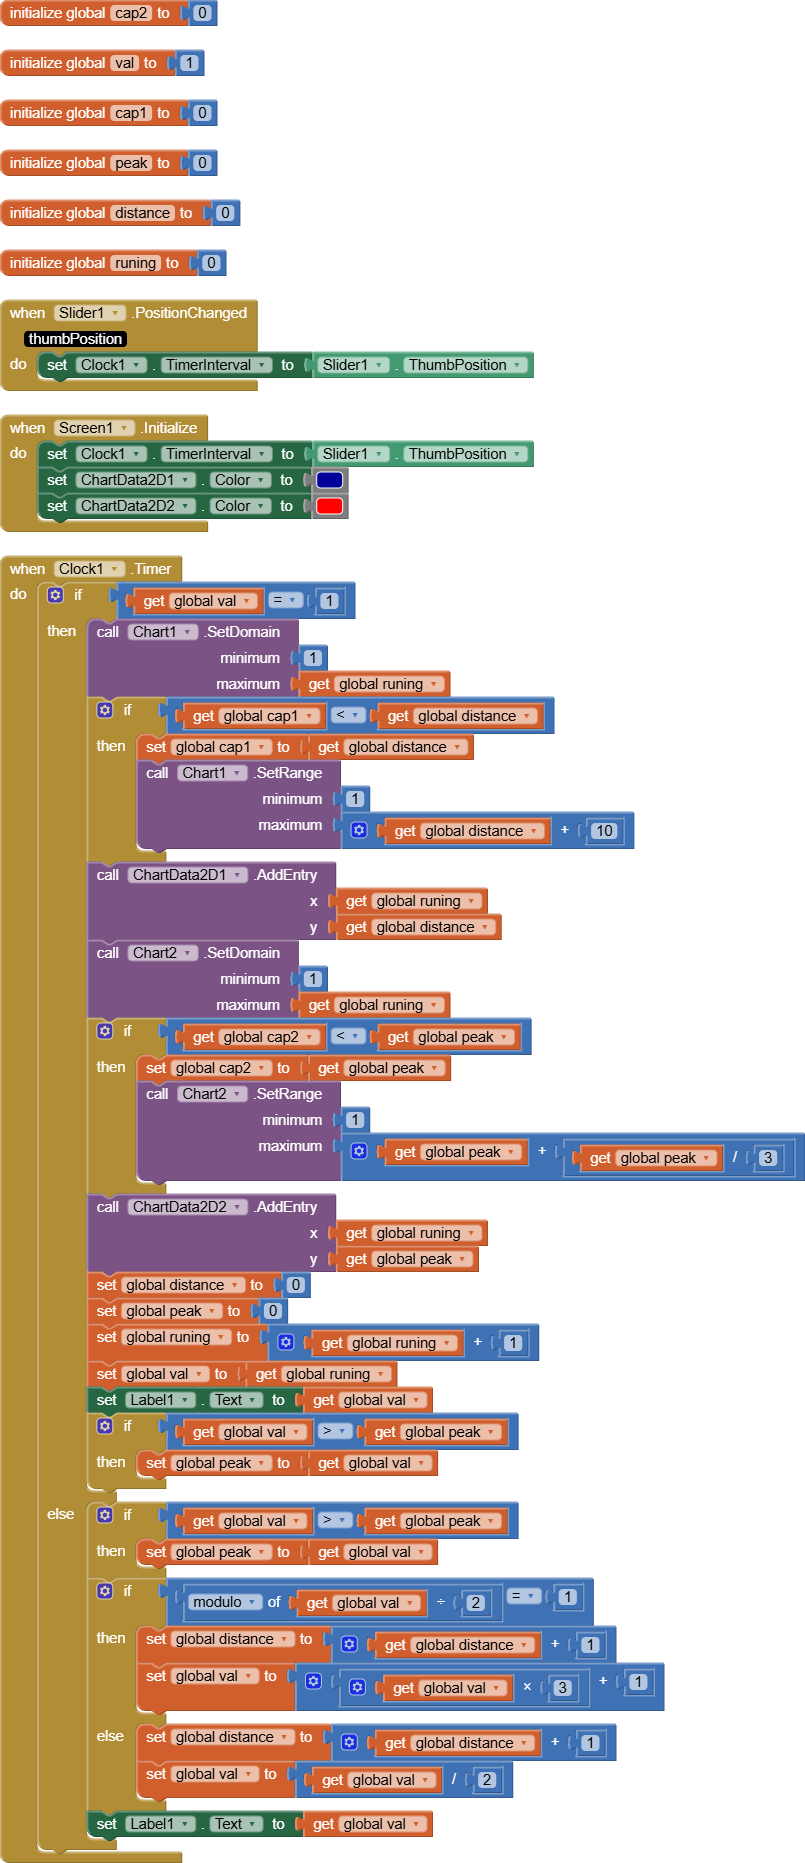
Display of the Collatz conjecture on graph,
It is an idiot proof progect once you initialize the program will begin to graph. This may take a long time.
I created it for a school progect but decided to share it with the world through this community.
Pls ![]() + Share
+ Share
The x axis shows the number it ran the Y axis shows the number of steps it took to complete it.The slider adjusts the rate it runs calculations at, slide left to go slower right to go faster.
Collatz_conjecture.aia (4.2 KB)
2 Likes
:3 Good job Thomas! ![]()
Hi,
You and @JunkoJoseph have the same IP address. Do you know each other or are you the same person?
2 Likes
Thomas is my Friend, I introduced him into This community and he wanted to try one of his favorite math formulas.
He is not new to App inventor, Just the community. He and me have a class where we learned about this through PLTW who sponsors Ai2.
PLTW
Project lead the way for schools.
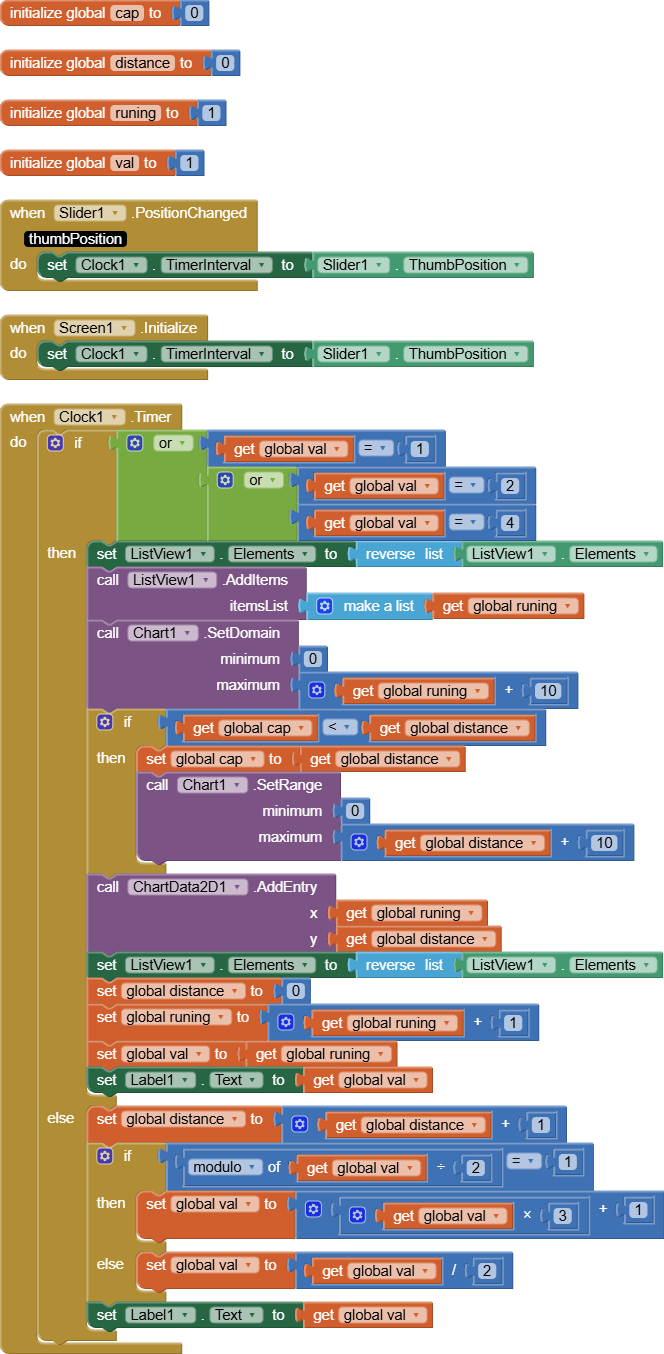
I think forgot to explain what the gragh is showing. But any ways it is showing on x axis what number it ran through the formula and the Y is the number of steps it took to solve it.
1 Like
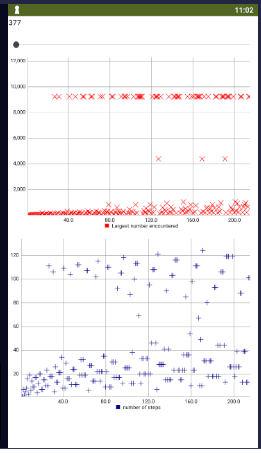
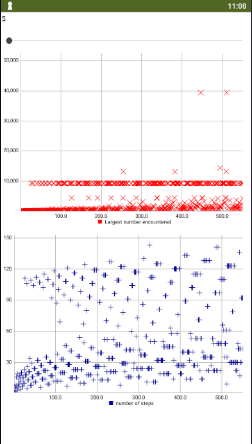
For better "viewing", set the colour of the cross marks to RED. Gets interesting after @ 200 iterations ![]()
1 Like
Have you tried using one of the AI2 data structures (list/dictionary/TinyDB) to track distances, so you don't have to re-evaluate numbers that were previously encountered?
Would that provide a speedup?
But I dont know how to use tinyDB's. So... ya
Here's a version that provides more information:Collatz_conjectureV2.aia (5.1 KB)
It keeps track of the biggest number encounterd while calculating the number through the formula and displays it on the new gragh, the X coordinate being the number it ran,the Y coordinate being the highest number encounterd while running the X through the formula.
Ya were not the same person.
The ListView doesn't add any value, it just takes up room from the graphs.
We already know how it looks to count up, one by one.
You can tell the current number by looking at the lower right of each graph.
Collatz_conjectureV2 (1).aia (4.9 KB)
(I forgot this was still running on my emulator.)
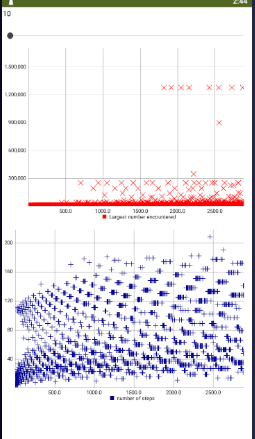
Here's after 3,000 numbers have been calculated:
1 Like
You can just "run it" for a set number. Here I set to 250
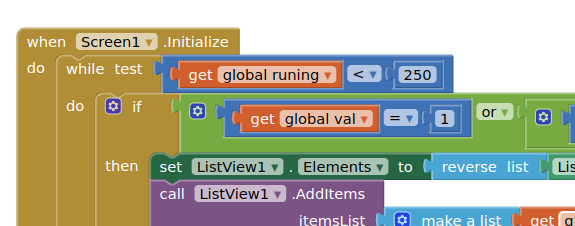
You have to wait until it finishes before it shows the graph, but it speeds things up.
I like the Show Biz aspects of displaying the wandering number search live.
Consider adding Save and load features that could capture the ChartData points and save them into TinyDb, so they don't go to waste if you want to resume calculations later.
I wanna make graphs like this:
2 Likes
I'll see what I can do.Heads up your going to need to set the size to montoir.
Sorry its been a while I didn't code alot over summer.I looked into it it I would have to make a extension to make 3d graphs and I don't have the tools or the knowledge to do that.But I could show you some of the results.That is if you see this post.
My comment above what purely rhetorical, I didn't expect a solution, just showing an extreme example.
Oh.... so that's 2 hours of my life in the trash. ![]()