Hi! I'm using the ChartMakerPlus to create a graph-analyzing app. 
Topic of my app:
Hypertension data recording
Briefing about my plan:
- Users can type the systolic and diastolic data in textboxes
- The data will saved once the "SAVE" button is clicked
- The recorded data will be analyzed in multiple line graph
The problem that I am facing:
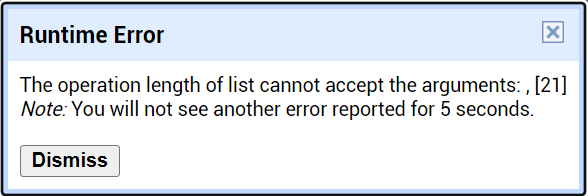
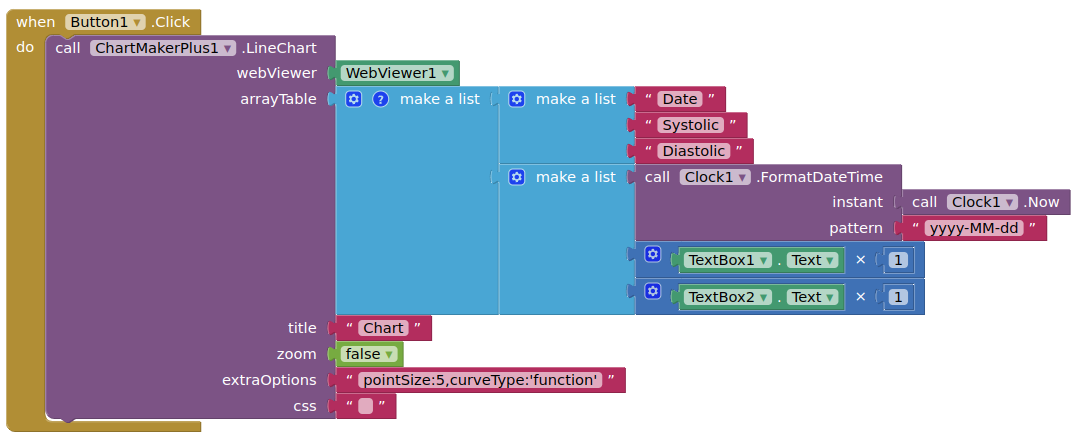
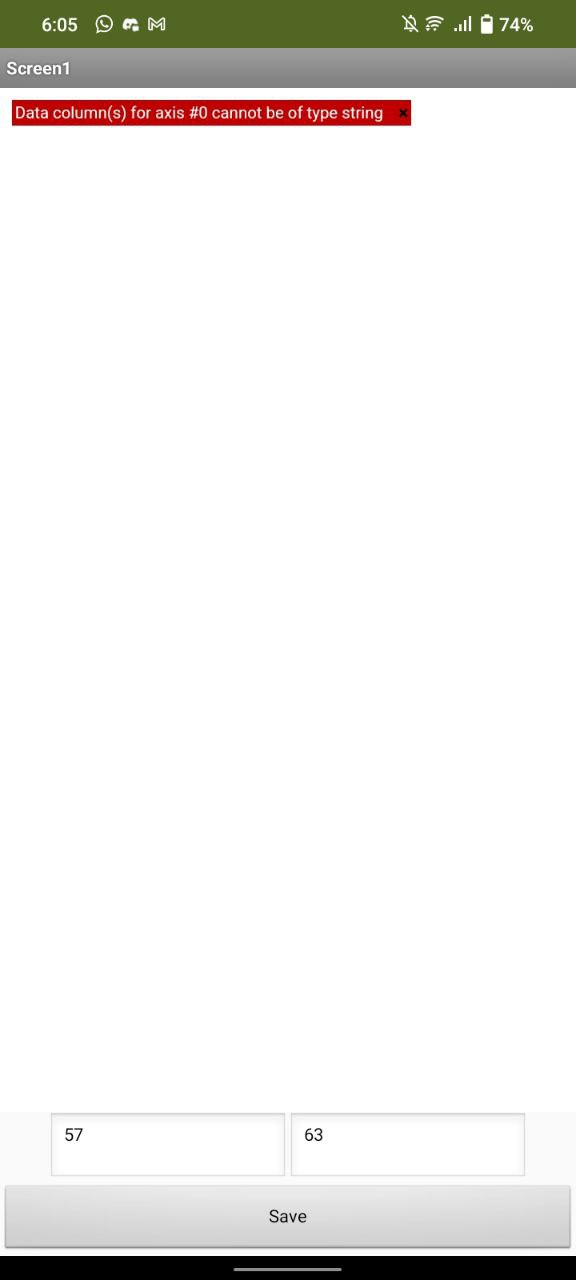
- The lines are not present although data is saved
- Runtime error (refer to the picture below)
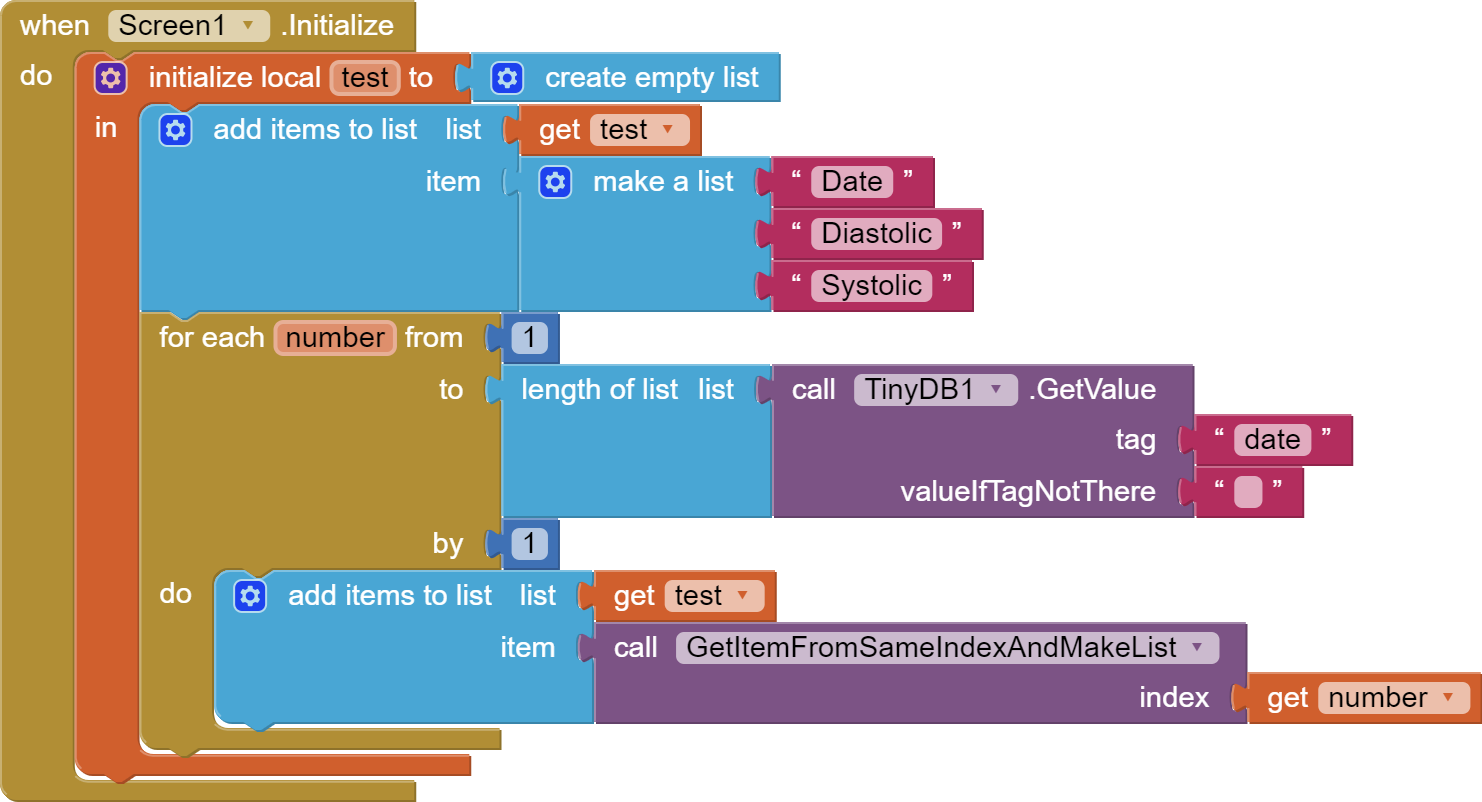
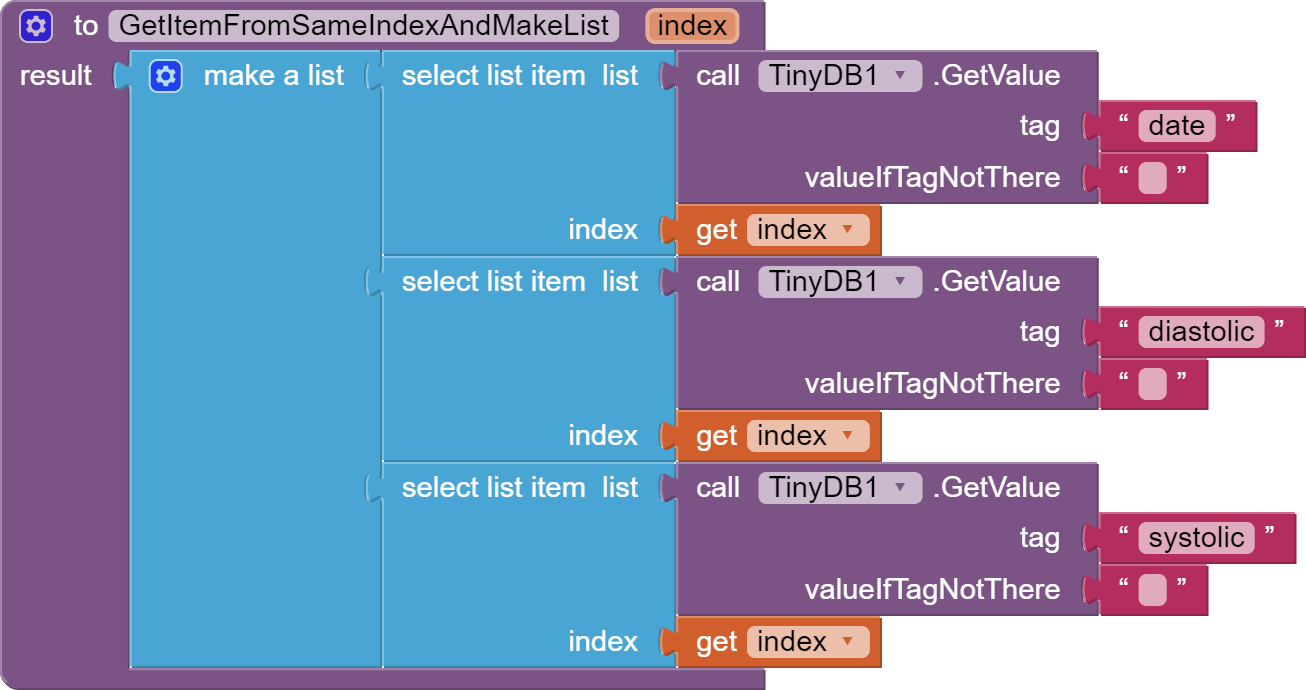
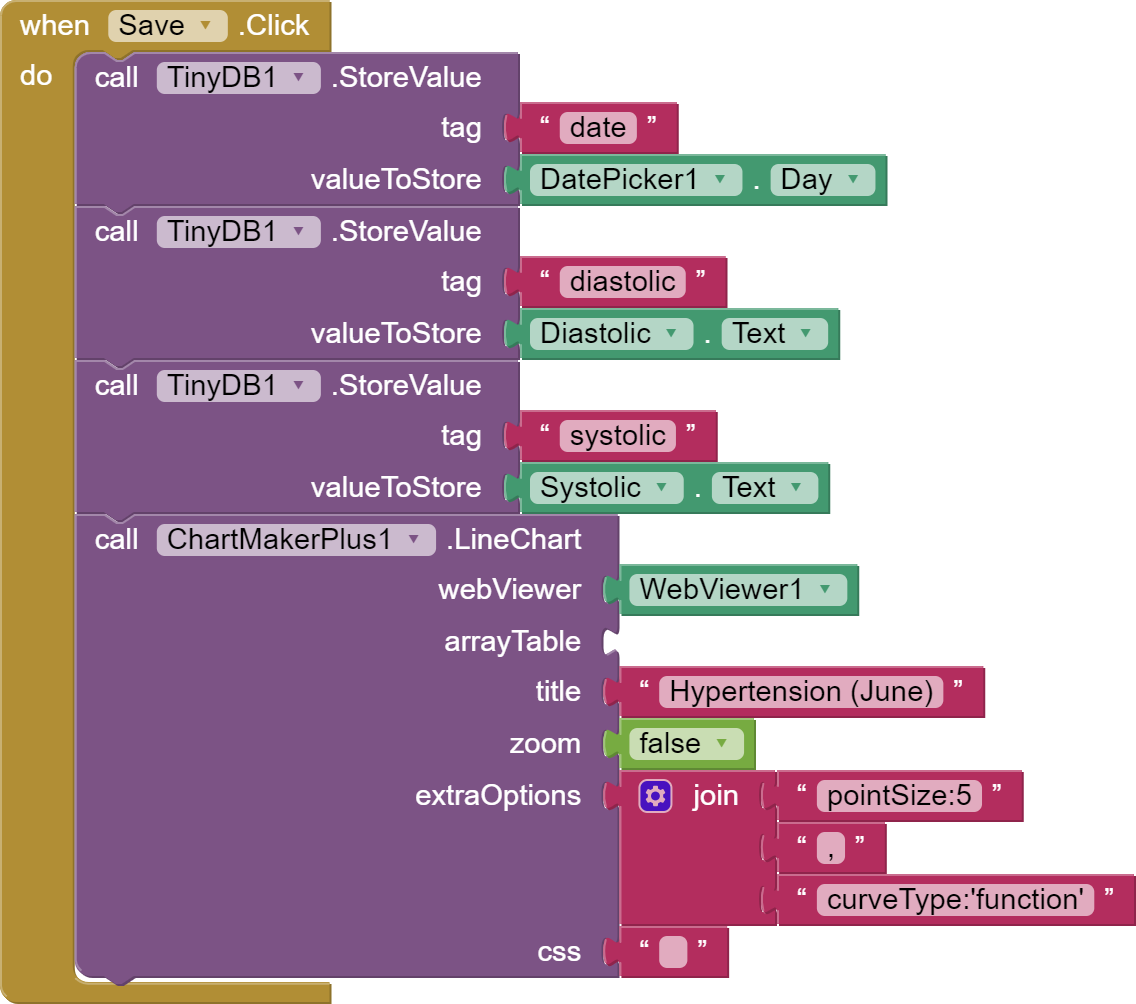
These are the PNGs of my blocks: 
Hoping someone sends me a helping hand... Greatly thanks! 
TIMAI2
2
How many records are you intended to display on the chart ? Just the one ? If so you will only see two dots on the chart.
More than one 
My planning is the records can be saved once a day. And the label at x-axis will present based on the present day when data saved.
TIMAI2
4
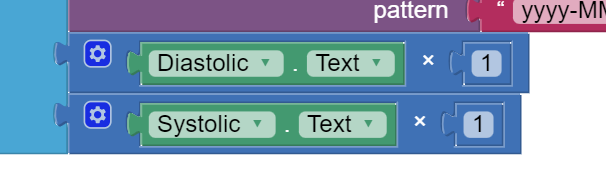
OK, here are the basics for just one day
You need to ensure that your textbox values are numbers
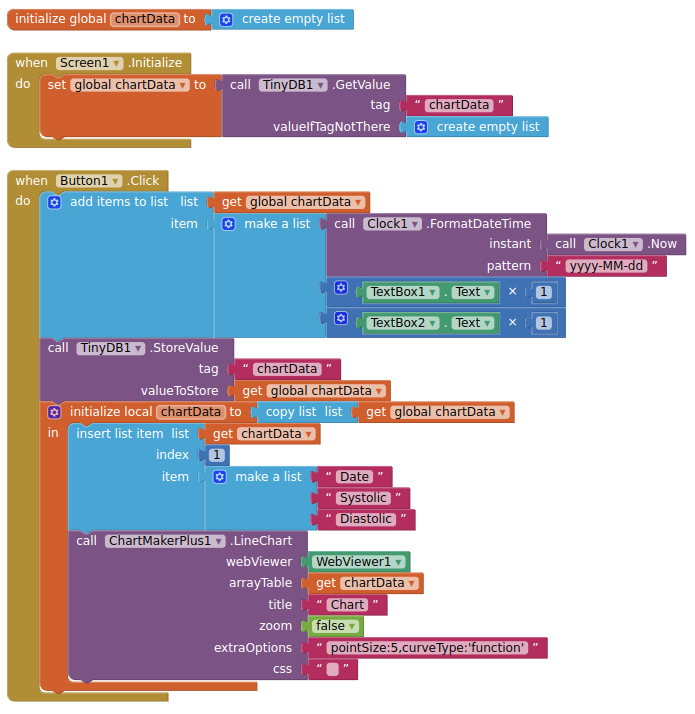
Thanks! It's worked! What should I do the next so more than one data can be saved?
Before that may I know what is the purpose of these blocks? Curios haha
TIMAI2
7
You need to ensure that your textbox values are numbers
Noted. Already set "NumbersOnly" in properties~ 
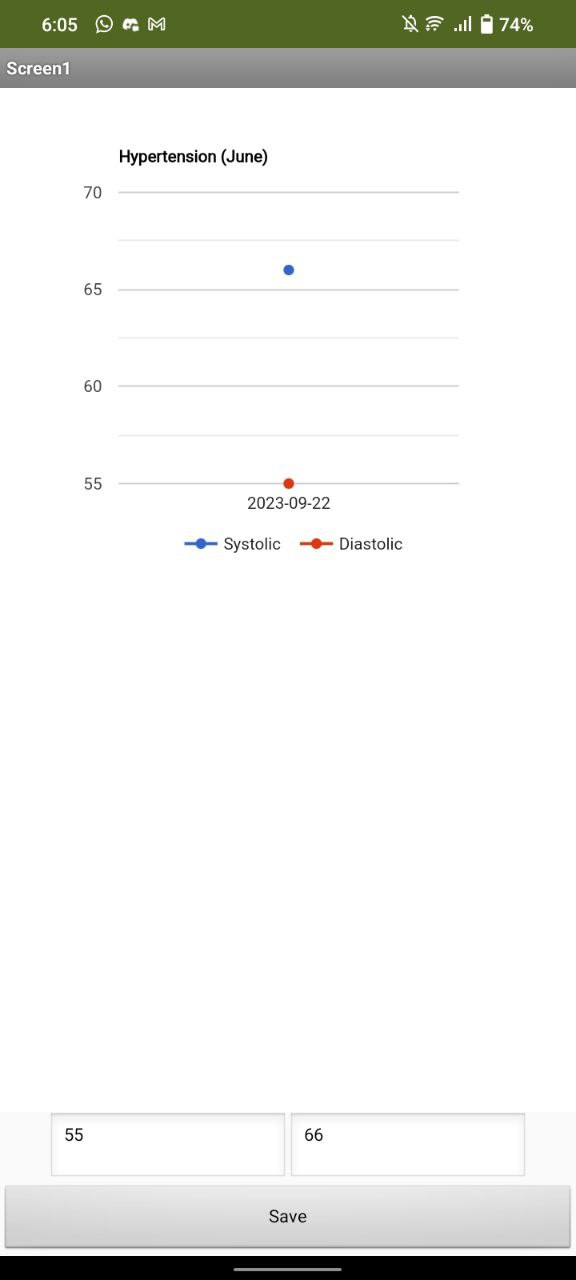
Thanks! Here's my first result, the points showed successfully!
But when I added the second result, an error was presented
What's the problem? Sorry for disturbing you!
It's okay, I've already solved it. Thanks a lot for your patience and guidance! 
system
Closed
12
This topic was automatically closed 7 days after the last reply. New replies are no longer allowed.