Two questions regarding the built in Chart Component and one regarding the ChartMakerPlus extension. (line graphs)
Chart Component:
Is there a way to control the zoom level with code? If the user manually zooms in, I need the code to reset the zoom level when new data comes in and a new chart is drawn.
Is there a way to reduce or eliminate the data point size. I typically have thousands of data points and it makes the line look fat until you zoom way in.
The ChartMakerPlus extension overcomes those two problems, but there is one problem I haven't been able to resolve:
Is there a way to set it up for independent horizontal and vertical zoom, like you can with the built in Chart Component?
ChartMakerPlus runs in a webviewer, so you get the zoom features provided by the web view. It may be possible, with css, to provide alternate zoom features? Of course, you can set the height and width of the chart as you wish
Thank you, that might work for me. If I could make x values expand faster than y values, that might be helpful.
But, so far, I haven't been able to put anything in CSS that makes any difference at all, including simple things like changing colors. I obviously don't know how to use it.
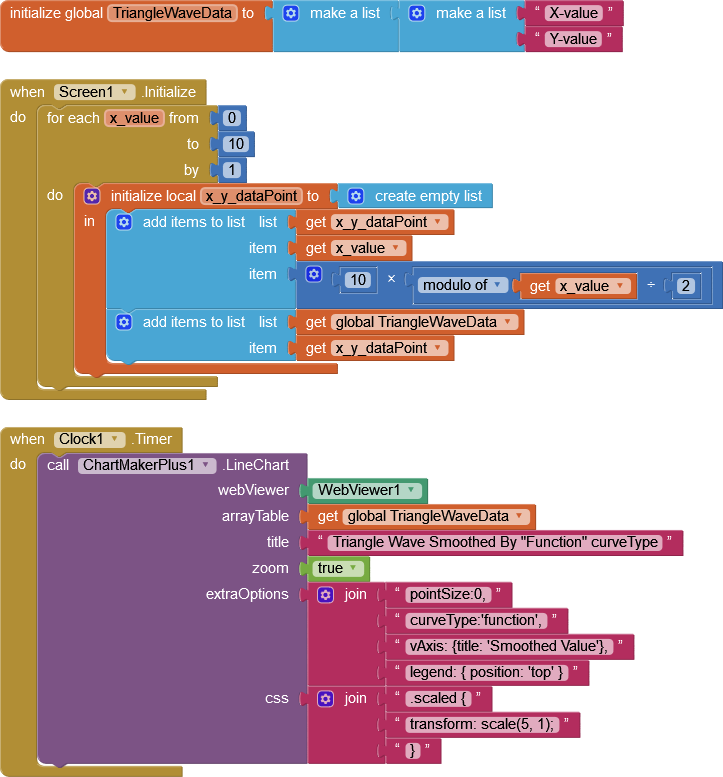
Here's a simple app I made to help me experiment with ChartMakerPlus. I set the clock timer for 5000 milliseconds to give me a little time to test if anything I put in CSS changes the zoom characteristics.
It is likely that the google chart, being online, is unable to cope with the refresh turnaround you may be expecting? It probably takes between 3-5 seconds (minimum) to turn around new values and re-display the chart.
Chart rendering time isn't great, but it's acceptable. Chart Component and ChartMakerPlus have similar rendering times with large data sets. The advantages of ChartMakerPlus are that the data point size can be 1 pixel and that the zoom level is reset with each new rendering. If the horizontal and vertical zoom rates could be independently controlled, that should be everything I'm looking for.
Yes, that works on the sololearn website, but how is that relevant to the ChartMakerPlus extension?
My understanding is that ChartMakerPlus is based on Google Charts, so I've experimented with using various iterations of the "explorer" option, in both the extraOptions and css sections of ChartMakerPlus, but nothing makes any difference.
I've scoured the appinventor forum to find any mention of using the css section of ChartMakerPlus, and only found one reference to it, and that was for a table, not a chart.