Hi everyone, this is my first post. I did some research but did not find what I need. I need to make circular progess graph with two colors but each color is one imput, like 50% and 75% 50% one color and the difference to 75% (25%) in another color.
Do you know if there is an extension for this?
Tks
you can search yourself for extensions in the extensions directory here
Taifun
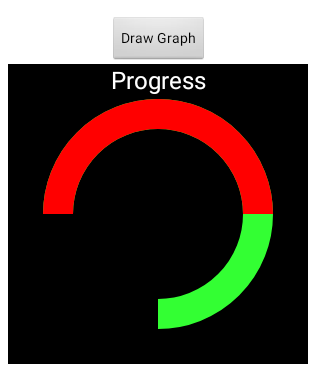
You should be able to do this without extensions, using the canvas, and the drawArc method, or you may be able to achieve something using the Chart component with a pie chart (with a hole).
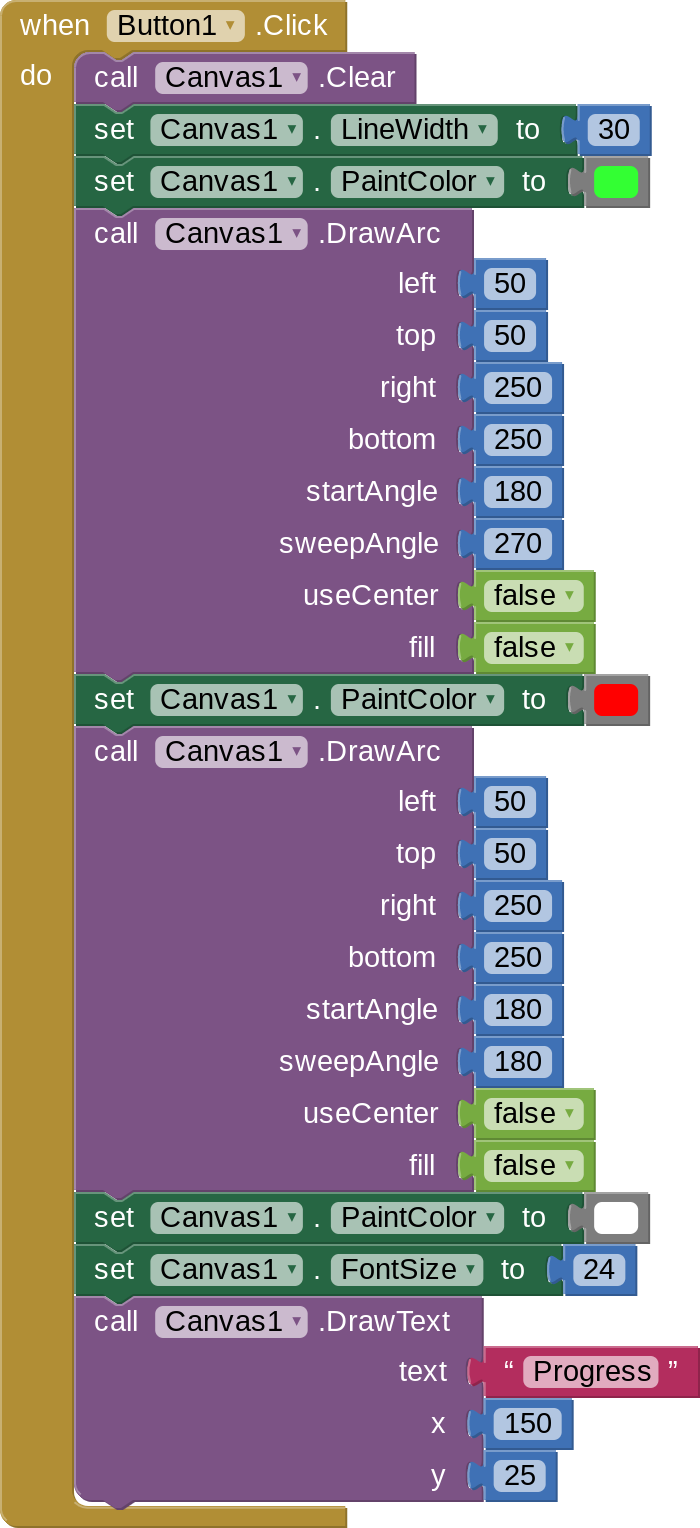
With canvas:
1 Like
Tks, this is a great start,