Chart zooming in and out

Hi everyone.. Trust you all are well.

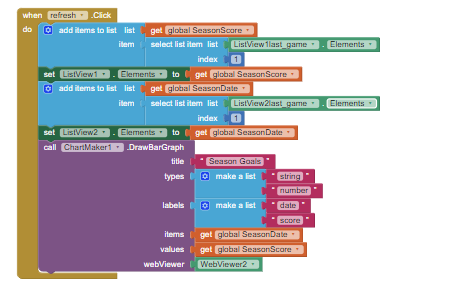
I currently using the chart extension and happy how it works but I don't like the idea of zoom in and out.

Two things:

  1. Someone on community suggested that I should look into Google Charts and add my info there but I have no idea where to start even. Can someone maybe help me out in right direction.

  2. Easiest solution to my problem will be to have extension not zooming in and out.

I have information reading from a listview so my charts should have no limit please.

Thank you in advance

Attached of my current chart extension.
pic

so what's your question? how to disable the zoom function?

Yes disable the zooming function and only have one fix size.

Actually had two questions, that was one and other one was, if there is away to learn about Google Charts.

Try googling it

uncheck the zoom property of webviewer in design layout

The CustomWebview extension provides a disable Zoom block

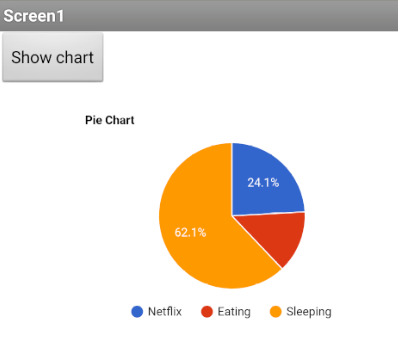
Here simple example html to build your own chart, including the meta to prevent zooming.
You can use the webviewstring to pass chart values to the html.

<html>
  <head>
    <meta name="viewport" content="width=device-width, initial-scale=1, maximum-scale=1, user-scalable=0">
    <script type="text/javascript" src="https://www.gstatic.com/charts/loader.js"></script>
    <script type="text/javascript">
      google.charts.load('current', {'packages':['corechart']});
      google.charts.setOnLoadCallback(drawChart);

      function drawChart() {
        var data = google.visualization.arrayToDataTable([ 
          ['Activity', 'Hours Spent'],
          ['Netflix',7],
          ['Eating',4],
          ['Sleeping',18] ]);

        var options = {
          title: 'Pie Chart',
        };

        var chart = new google.visualization.PieChart(document.getElementById('pie_chart'));
        chart.draw(data, options);
      }
    </script>
  </head>
  <body>
    <div id="pie_chart"></div>
  </body>
</html>

image

Thank you for feed back..

I have downloaded the custom webview extension.
But struggling to get chart working on it.

Please correct me if I am wrong, can I attach the custom webviewier extension and chart extension together.

Or will I need I need to make a whole different pie chart.

You should be able to load both extensions. I have not used chartmaker with custom webview will test out to get configuration sorted.

Hmmm chartmaker extension expect a webviewer not a custom webview, doesn't look like it works.

Thank you, is okay.. I will just have to try something else unfortunately I guess.

Sorted off the topic but still on charts, I was thinking to move everything to a google sheet instead and then do the charts on there.

Because I am very new on Google sheets desgin and apps. Will each user have his own sheet?

I don't want users information to be shared./ mixed up. Hope it makes sense and clear enough.

Thank you in advance

I may have a go at building a "no zoom" version of the extension (which is open source) which will work with the webViewer....

1 Like

Yes, with a bit of work you can do that. One way....

or

Just incase anyone finds themselves in the same zoom issue.

This is what I did to help my app:

Put all my Pie charts in vertical order.
Made webviewers height 28 % which gives chart just enough space for everything.
Put screen scrollable on.

Not exactly what I wanted but does the work.

Thanks for all suggestions
Be safe

For what it is worth, here is a reworked Chartmaker extension which prevents zooming in and out.

uk.co.metricrat.chartmakernozoom.aix (11.5 KB)

Credits to Mills College for the original extension

Thank you so much.. Helped me a lot

This topic was automatically closed 7 days after the last reply. New replies are no longer allowed.