Hello,
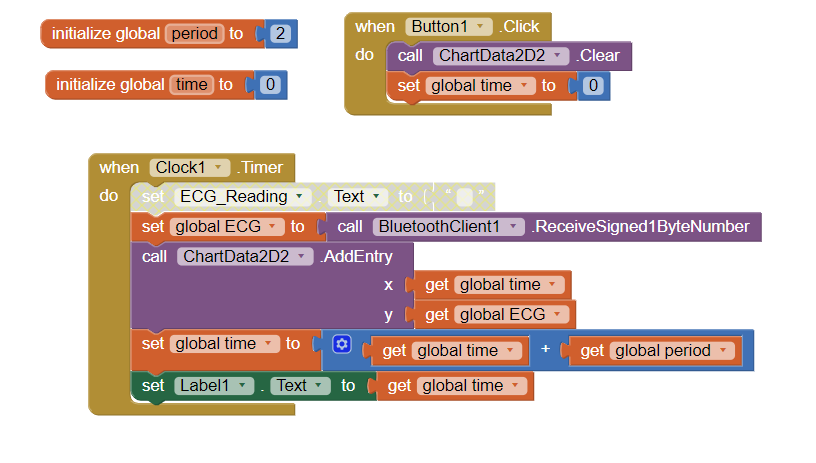
I am working on an ECG application and when using the Chart Data 2D, the line chart shows labels of each value. Is there a way to turn this off, or is there another way to plot the value without showing labels?
Hello,
I am working on an ECG application and when using the Chart Data 2D, the line chart shows labels of each value. Is there a way to turn this off, or is there another way to plot the value without showing labels?
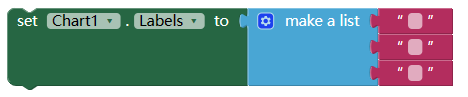
not tested:
Thanks for your reply.
Sorry for the confusion, I meant on the graph plotted, the value of each point is shown. Is there a way to remove this value from the points?