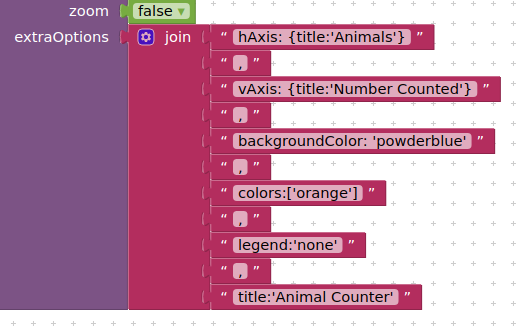
Hello, I have made a line graphic thanks to the ChartMaker extension. When I have made a simulation, I have seen that it is shown quite small and the interval should be better. Is there a posibility to modify the graphic and increase the X,Y interval, make the line thicker (this is not important) and make the graphic bigger?
Here I show the graphic that it has generated (ignore the buttons).
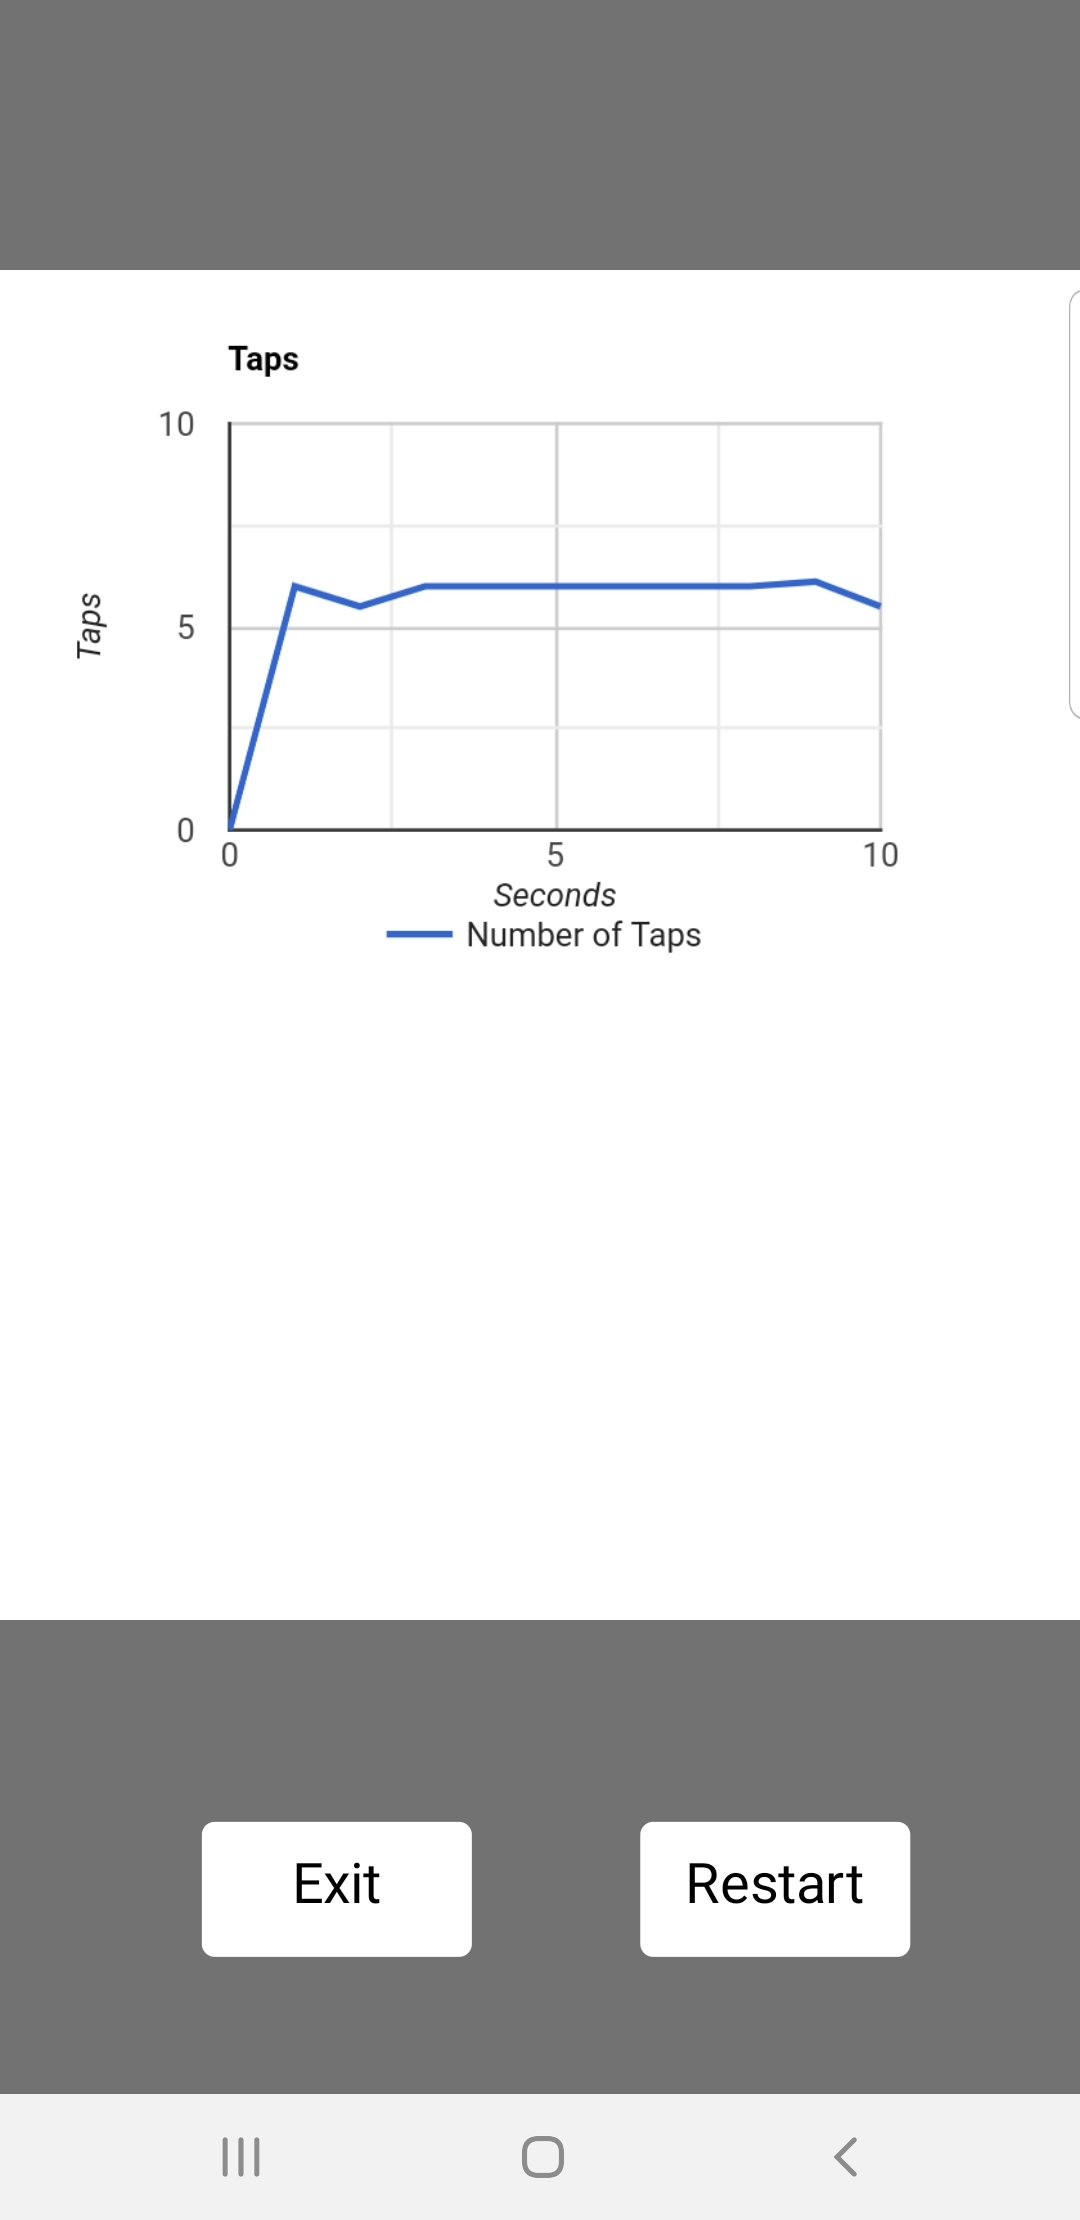
Maybe it will be perfect if I can make the intervals like this: [0,2,4,6,....] or [0,1,2,3,4,....]. Both options would be fine.
Thanks for your help.