New to MIT App but already did quiet a bit of work. Figured out BLE and much more.
Probably not thinking hard enough on this, but would like to hear an experienced input:
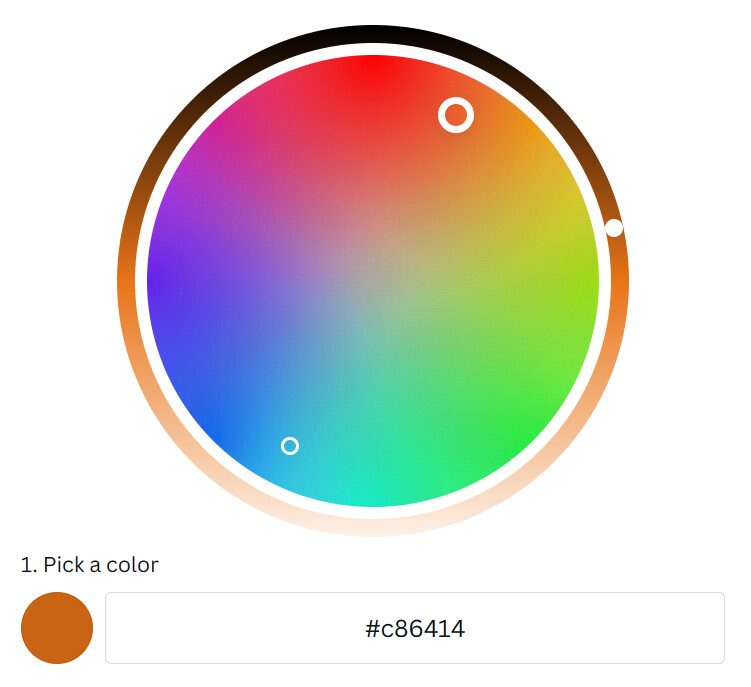
I have a color wheel, when picked coordinate with cursor it changes a color canvas and changes R G and B sliders to correct position to match the color coordinate.
Now how do i reverse control by changing position any of 3 sliders to change coordinate of the color wheel?
Then comes the slow part: Iterate over all the points of the color wheel, take the Canvas pixel color for that point, and evaluate its color distance from the slider values. Keep the coordinates of the best (minimum distance) one you have encountered so far in the loop.
If you have good math skills, you could try taking advantage of the continuous nature of the color wheel to stab it with color probes in some kind of search pattern, to get a speedup.
Off the top of my head, the only real way to do this is to carry a list of every single pixel and its coordinates, and its RGB colors. Then when you adjust your sliders, you can search the list for the correct pixel, and return the coordinates.
The dot always lies in one of the two sectors representing the two colors that have the highest values (if all three values have the same value, the dot will be at the center).
Increasing the value of the smallest value will result in the dot moving closer towards the center. This seems to follow a straight line, and it also seems to be linear in proportion to the change of the smallest value. In this case (RGB(200, 100, 20/50)), the value of blue is changed from 0 to 20, and then to 50:
The dot seems to be following a straight line between the center and the initial position of the dot, and the slope of the line can be calculated, if the coordinates of the initial position is known.
While I can't be certain, it seems like the initial position of the dot (or, rather, the inclination of the straight line connecting the dot to the center to a line parallel to the bottom) can be calculated through the ratio of the highest two values of the three colors (for simplicity's sake, I'll let this ratio be x:y). The circle is divided into three sectors, so, each arc of each sector subtends 120 degrees at the center. I'm assuming the sector (because the dot can only exist in one sector) will also be divided into the ratio x:y by the line joining the center and the initial position of the dot. And, since you know the angles of the sectors formed by dividing the original sector, you can assume the line joining the dot to the center, a diameter parallel to the base (a straight line with a slope of 0), and a perpendicular from the dot to the diameter forms a right-angled triangle. The tangent of the angle between the line joining the dot to the center and the diameter is the slope. Because the center must also satisfy this slope, you can calculate the value of the y-intercept. Now, you have one equation, that being y = mx+b, where m is the aforementioned slope.
Also, since the initial position of the point lies on the circumference, the distance between it and the center is the length of the radius; or sqrt(x^2+y^2) (using the distance formula) is equal to the radius. Substitute y = mx+b in this equation, and you get a quadratic equation: x^2(m^2+1) + x(2mb) + b^2 - r^2 = 0, where r is the radius. Plug the values of x into y = mx+b to get the values of y. You'll get two values of x from solving this equation, and only one will be right. You can filter the wrong one out depending on the maximum value (if red is the highest value, the correct value of y must be positive, and so on).
Finally, you can use the section formula to find how far down the dot will be for the third value (this should work, if the assumption made in point 3 is correct).
I'm not sure if this works, but I think it's worth a shot (though the solutions provided above this post are probably easier to implement). I'll try to do this programmatically.