Hello everyone, I'm here again...this time my question is about "how to read and use" data into HTML file with javascript...I'm in this condition:
- I have a big block that send to a "WebView" a big list like (for example):
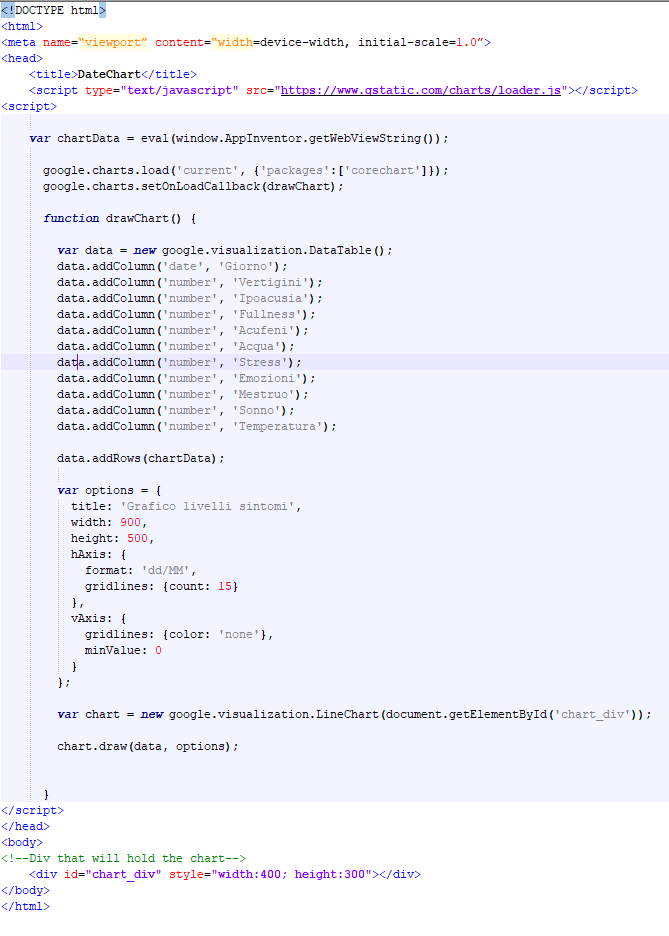
[[new Date (2020, 11, 03), 2, 3, 4, 5],[new Date ((2020, 11, 04), 5, 6, 7, 8]] - at the other side I've the classic HTML file like this:
Now what I want to do is to change data.addColumn's second parameter with a new one send via "getWebViewString" from AppInventor....
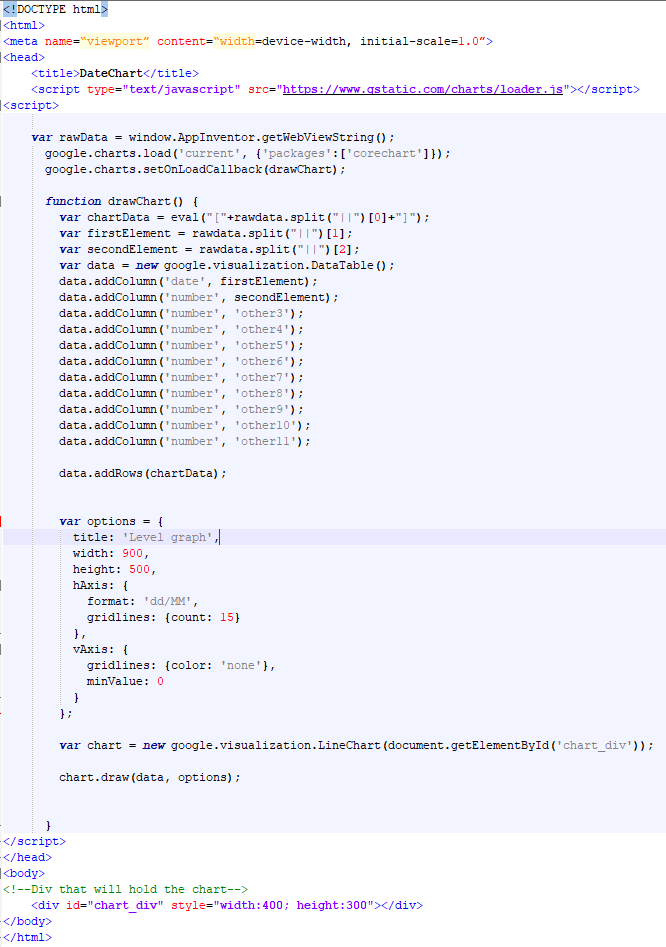
I've tried to do it adding, at the end of sended string, the new name after "||" char, reading it via SPLIT method in javascript...
- so, the new data sended il like
[[new Date (2020, 11, 03), 2, 3, 4, 5],[new Date ((2020, 11, 04), 5, 6, 7, 8]]||FIRST||SECOND - the new HTML FILE is like this (only for example I try to change only two elements)
I've tried many many times whit other ideas but I cant do what I want....there is someone that canm help me?
PLEASE ![]()
TY a lot....