I use this block to implement the graph and see the result in the app as shown below.
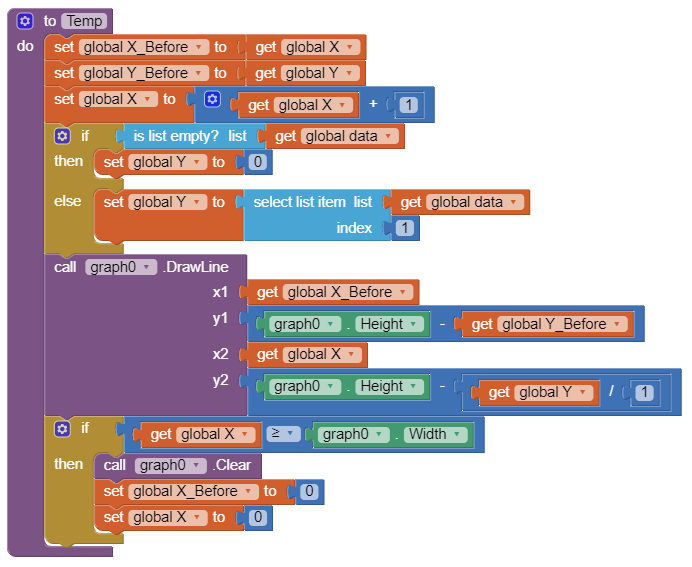
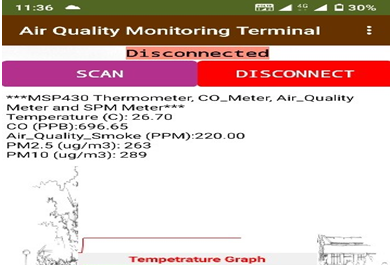
But I want to add the labels of the graph. Please suggest me how to do this.
I use this block to implement the graph and see the result in the app as shown below.
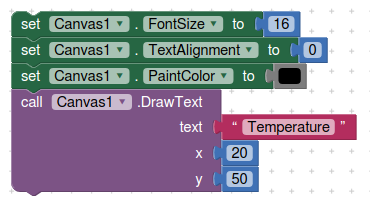
Use the DrawText blocks for the canvas, positioning with x,y coordinates, along with properties for size, colour and alignment.
I want to add x labels and y labels to the canvas i.e. I plot a time vs temperature graph where in y axis define as temperature and x axis as time.
As per your suggestion, it is used to point out a coordinate.
Are you having trouble with the math to transform degrees C to pixels Y ?
No,
I am trying to add a label of x-axis and y-axis respectively just.
But no such block available in canvas is used to define labels.
Try https://groups.google.com/d/msg/mitappinventortest/VFS8keX4cQ4/GuqnEmqzCAAJ
from FAQ Section: Charts and Graphs
You obviously didn't read my post above!
Very Very Sorry!!!
I did not understand the blocks defination which you are sending.
Now I understand it and thank you for your help.
This topic was automatically closed 7 days after the last reply. New replies are no longer allowed.
