Hello everyone, now i got a problem with chartdraw line. My data is save with array (list) type. Example: List voltage [0, 10, 20, 30] and list current [10, 20, 30, 40]. I use chartmakerplus to draw linechart, but i don't know to get 1 pair of corresponding values to draw a graph. Who can help me?

Thanks you so much for your help, i will try it <3
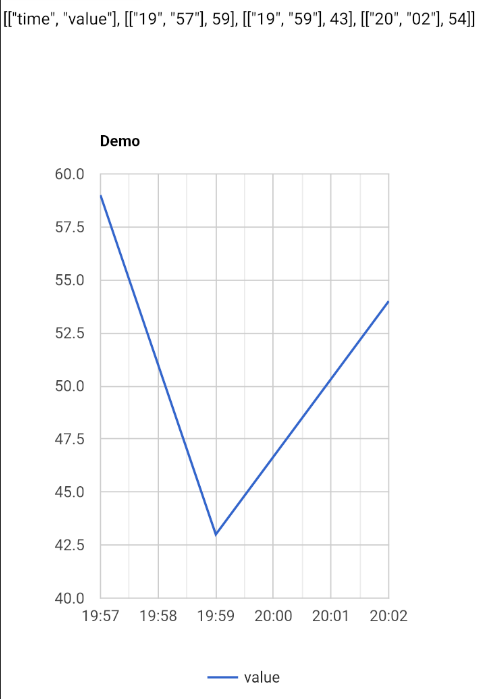
You only provide the chart with a single record, that is why you only get one point. You need to add the latest clock time to a list, not set the latest clock time to the variable. You also need to add your dataChanged values to a list.
2 Likes
yes that is something i have not done yet i need your help can you draw a sample for me

You may also need to combine your lists to make a valid array for the chart.
1 Like
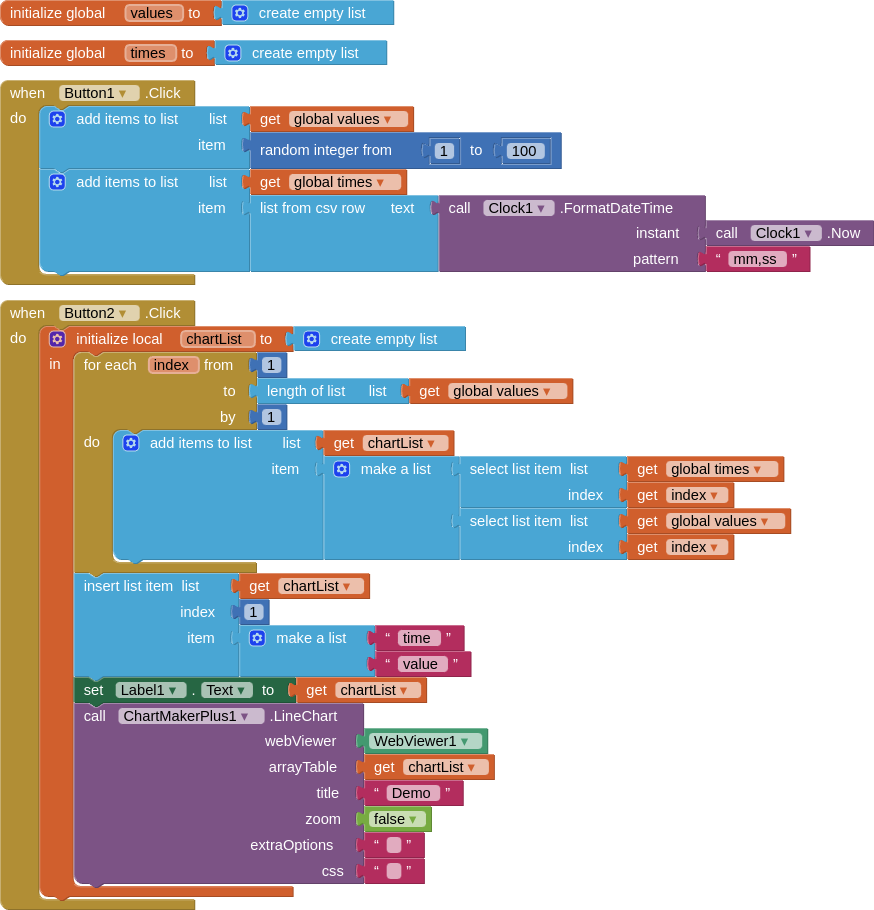
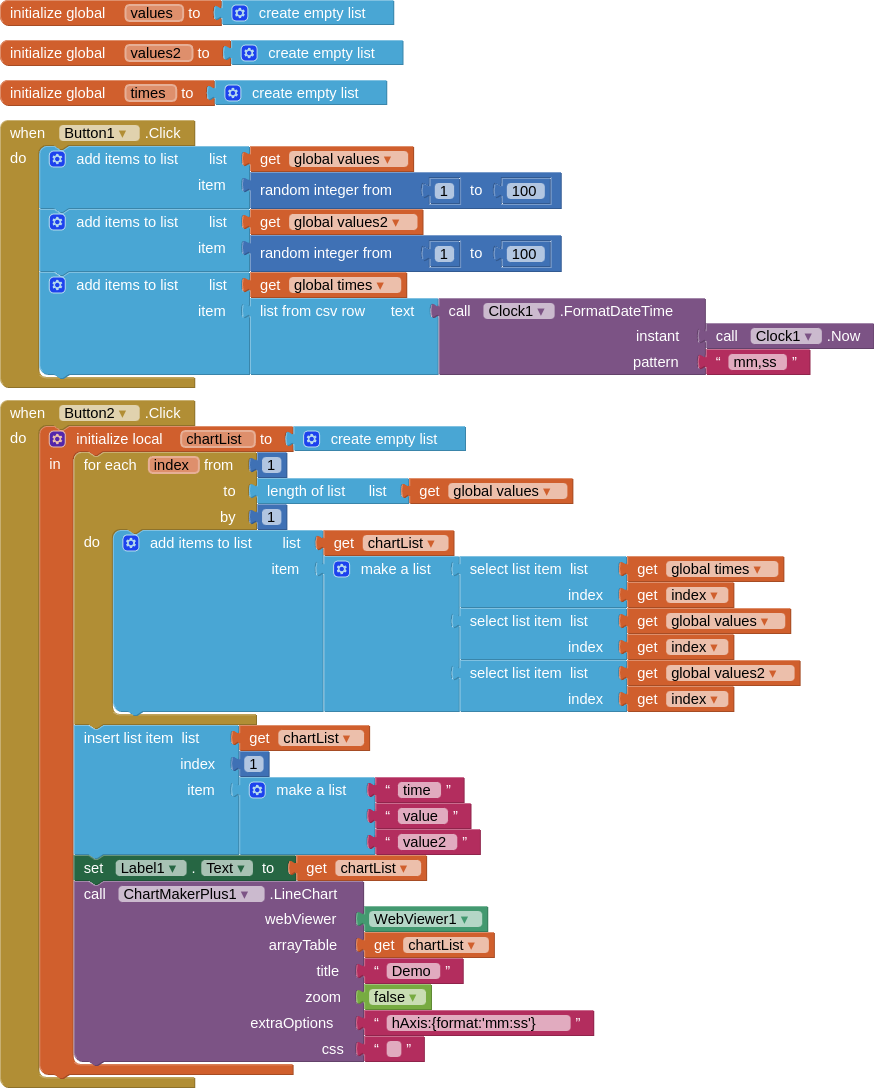
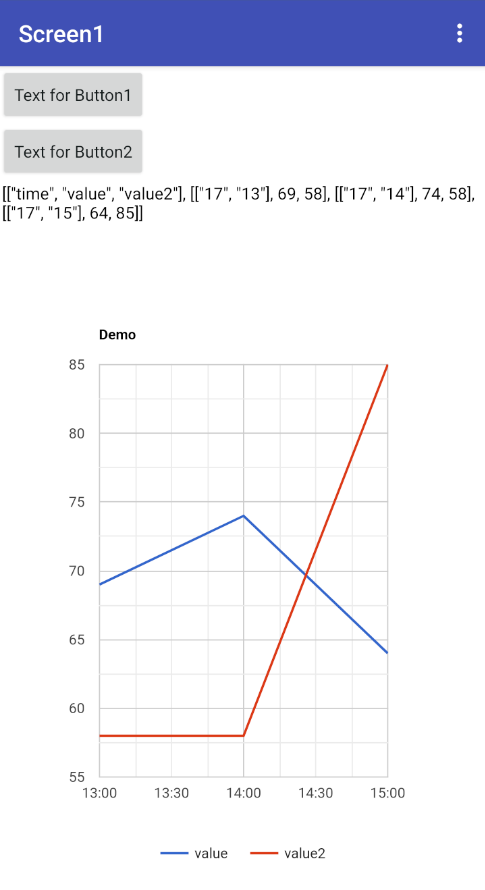
Thank you very much, i did it thanks to your example but now i want to add another line to this chart, so can i create a list like that and how to add to LineChart
oh nice, thank you very much