With Charts it is not possible to make a display table with these graphics
with Chart component? No...you can make charts...but not a table like that.
Extremely difficult for me to do.
I couldn't even do the previous question
I'm a beginner and trying to learn on my own with what I can grab here and there...
Have you ever heard of Murphy's Law?
It should be in your mind constantly as you code.
When you are dealing with TinyDB, there are at least two things that can go wrong when you do a lookup:
- Nothing comes back, so you must code a proper default value that will support whatever operations (math, lists, dictionaries) that you will perform on the returned value
- Something left over from testing or another app(if in the Companion) comes back, that needs to be checked using the Is A ... blocks.
Here is some super bulletproof code for retrieving a list of employees from TinyDB ...
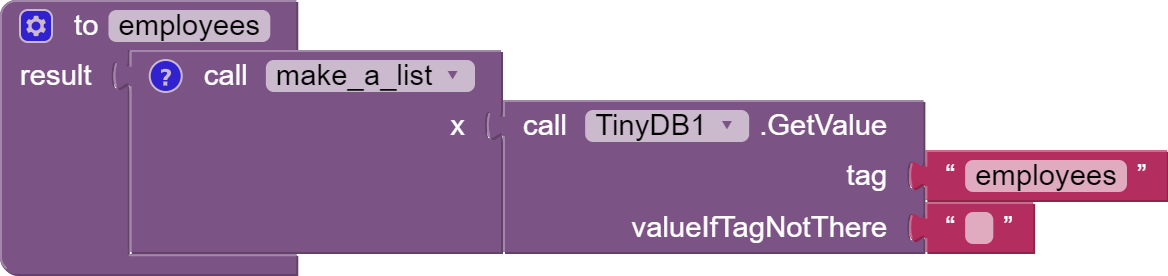
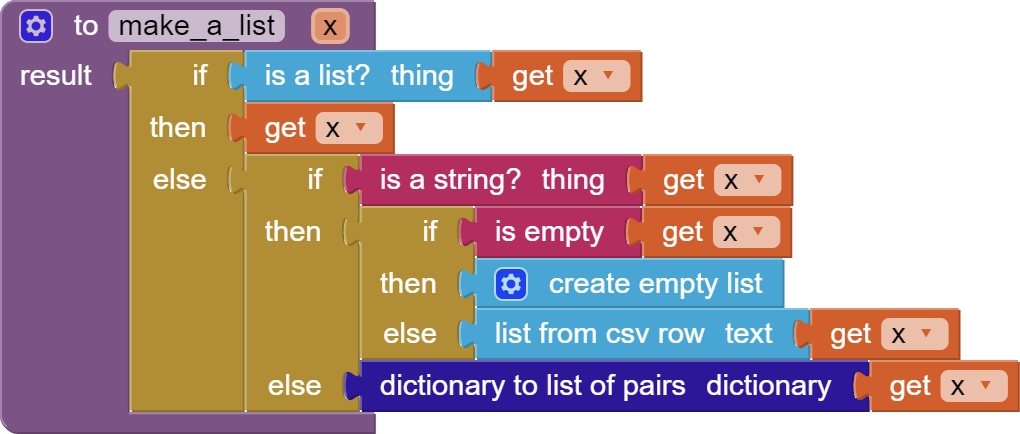
In this sample code, I force whatever comes back to become a list, because I must have a list.
Can anyone learn the alphabet starting with Ω or Z and then go to R or A and then continue to P etc.?