To be able to graph all four sensors, you are going to need the data in a form like this:
(3,10,29,38), (3,10,29,38)
rather than (Sensor_1 = 3,Sensor_2 = 10,Sensor_3 = 29,Sensor_4 = 38Sensor_1 = 3,Sensor_2 = 10,Sensor_3 = 29,Sensor_4 = 38) otherwise you will have to strip out the Sensor_1..Sensor_2 references. (When you use data like this Sensor_4 = 38Sensor_1 = 3 without a data separator between packets, you will have issues . This form works fine for a single data stream. Your app is supposed to have four data streams. The packets need to have a separator between each packet.
When you have a List, the first item is known to be sensor1 data, the second, sensor2 etc. Th text id's are a distraction. You will have to remove them to be able to plot the data on your graph.
Here are several Bluetooth tutorials (in Spanish) which show probably how you should capture your sensor data stream) Use them as a guide.
App inventor. Bluetooth, Arduino y App Inventor. Básico. Arduino envía información a App Inventor. .
Once you get the data stream from the Bluetooth in the 'correct' form into the Android,it will allow you to use the graphing method shown by Tim or one using a Canvas like this that uses a Canvas plot:
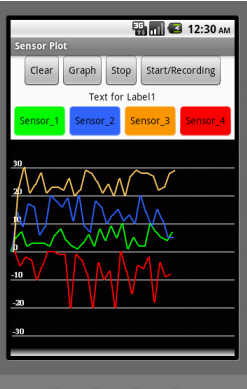
Exactly what you should do to graph depends on getting the data correctly into a csv file or List that streams from the Bluetooth.