Hello,
I have randomly generated 4 values in the Arduino with ESP32. Now i want to map the incoming 4 values (via bluetooth) in a graph. I can able to receive the values in my app but i cannot able to draw a line graph for it.
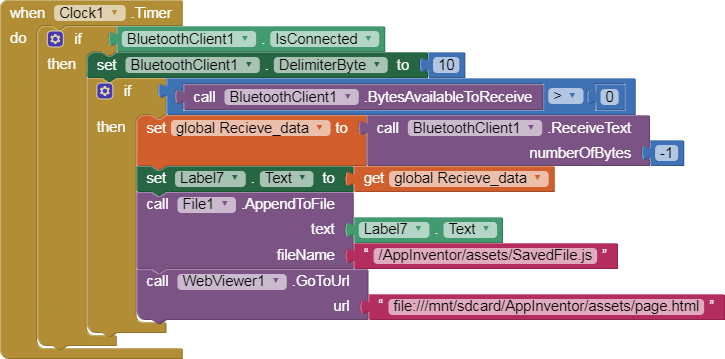
MIT data recieve|690x162
This is the one I have done. I am getting 4 values now i need to seperate the 4 values and draw line based on that random values.
can anyone please help me with that.
Thank you
There are numerous ways to create simple graphs. Here are some ideas from the old AI2 Forum.
…and FAQ Section: Charts and Graphs
What you do depends on what the four values you receive look like. How about providing an example of the data received from you Bluetooth. If we knew that, someone could provide specific advice.
The simple way would be to use a Canvas and plot points on it.
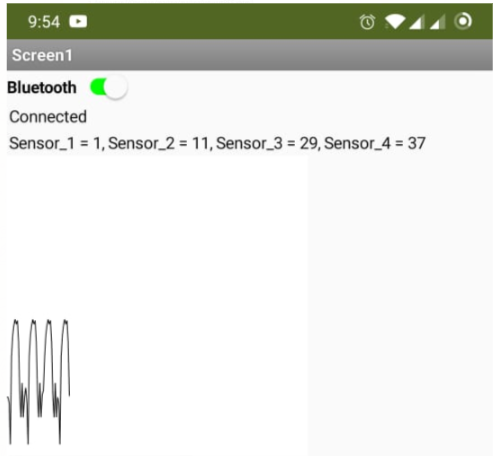
The 4 sensor values i need to plot in the below canvas. i can able to receive the data but i dont how to plot the incoming values seperately
Kindly help me regarding this, I have gone through the FAQ but i am not getting a precise solution for it. How can i draw the graph for those incoming sensor values.
You will not find a precise solution and will have to work out the details.
Here is possibility to plot the results of ONE sensor [Dynamic Graph] pdrepared by Juan Antonio (https://groups.google.com/forum/#!searchin/mitappinventortest/dynamic$20graph|sort:date/mitappinventortest/q-DGa_PVo_o/9yW89uL-BwAJ) You could try it out plotting just Sensor1.
You want the result from FOUR sensors simultaneously. That is more difficult. I am not sure how you would do that using the example.
Your data can be represented in a csv file like:
1,11,29,39 , These are the values of Sensor1, Sensor2,Sensor3,Sensor4 at one instant.
Later, these values might be
7, 15, 22,45 or something like that. These two instants of Data can be represented in a List of csv files.
Each value can be referred to as an index in the List . Values from Sensor1 would be index 1 in the List; Sensor2 would be index 2 etc. and each parsed from the csv to be plotted (perhaps in different colors).
Plotting in real time is more difficult than plotting from a List. Capturing a series of values on your Android and saved as a List and plotted using the List is an easier option.
I don’t have a Bluetooth/Arduino so I have no idea how you would do this. The link shows how you could do it with one sensor.
What have you tried?
new_try (1).aia (7.9 KB)
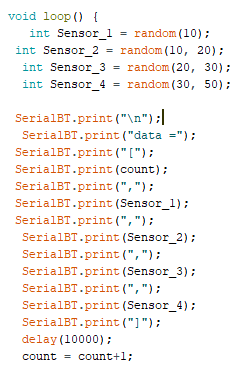
We are trying to read CSV file and get the values to plot the graph. But when we tried reading file it says, “Runtime time error: The operation list to csv row cannot accept the arguments: , [“Sensor_1 = 3,Sensor_2 = 10,Sensor_3 = 29,Sensor_4 = 38Sensor_1 = 3,Sensor_2 = 10,Sensor_3 = 29,Sensor_4 = 38”]”.
Kindly help .
Here is an example using google visualization charts(html)
HTML
<html>
<head>
<script type="text/javascript" src="https://www.gstatic.com/charts/loader.js"></script>
<script type="text/javascript">
google.charts.load('current', {'packages':['corechart']});
google.charts.setOnLoadCallback(drawChart);
function drawChart() {
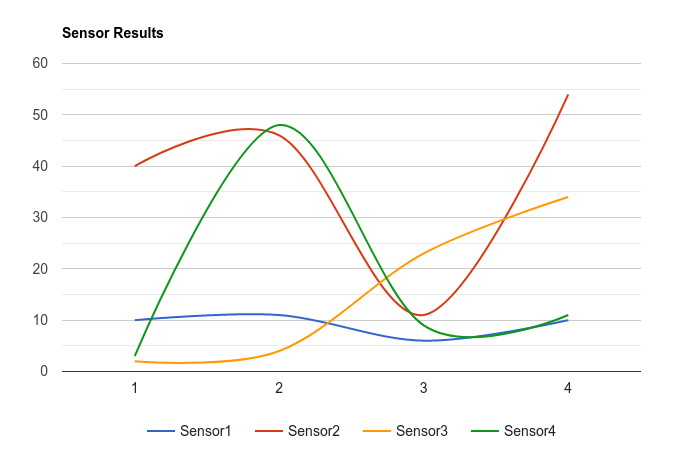
var data = google.visualization.arrayToDataTable([ ['Time', 'Sensor1', 'Sensor2' , 'Sensor3', 'Sensor4'], ['1',10,40,2,3,], ['2',11,46,4,48], ['3',6,11,23,9], ['4',10,54,34,11] ]);
var options = {
title: 'Sensor Results',
curveType: 'function',
legend: { position: 'bottom' }
};
var chart = new google.visualization.LineChart(document.getElementById('curve_chart'));
chart.draw(data, options);
}
</script>
</head>
<body>
<div id="curve_chart" style="width: 900px; height: 500px"></div>
</body>
</html>
You will need to organise your data so that it is formatted as shown in the html, then pass this to your html file using the webviewstring
1 Like
To be able to graph all four sensors, you are going to need the data in a form like this:
(3,10,29,38), (3,10,29,38)
rather than (Sensor_1 = 3,Sensor_2 = 10,Sensor_3 = 29,Sensor_4 = 38Sensor_1 = 3,Sensor_2 = 10,Sensor_3 = 29,Sensor_4 = 38) otherwise you will have to strip out the Sensor_1…Sensor_2 references. (When you use data like this Sensor_4 = 38Sensor_1 = 3 without a data separator between packets, you will have issues . This form works fine for a single data stream. Your app is supposed to have four data streams. The packets need to have a separator between each packet.
When you have a List, the first item is known to be sensor1 data, the second, sensor2 etc. Th text id’s are a distraction. You will have to remove them to be able to plot the data on your graph.
Here are several Bluetooth tutorials (in Spanish) which show probably how you should capture your sensor data stream) Use them as a guide.
http://kio4.com/appinventor/9B_bluetooth_arduino_basico.htm .
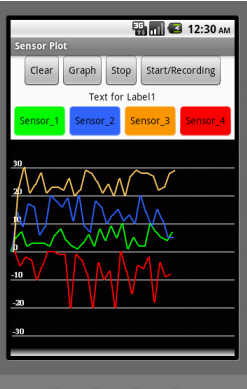
Once you get the data stream from the Bluetooth in the ‘correct’ form into the Android,it will allow you to use the graphing method shown by Tim or one using a Canvas like this that uses a Canvas plot:
Exactly what you should do to graph depends on getting the data correctly into a csv file or List that streams from the Bluetooth.
new_try (3).aia (4.7 KB)
    <html>
<head>
    <title>Graph</title>
    <link href="https://cdn.clipart.email/6c7d6ea17433d3e17bcf6801e5041eb8_53-speaker-sound-wave-sound-waves-clipart-clipartlook_1920-1080.jpeg"
          rel="icon"
          type="image/x-icon">
    <script src="loader.js" type="text/javascript"></script>
    <script id="Sensorjs" src="SavedFile.js" type="text/javascript"></script>
    <script type="text/javascript">

        google.charts.load('current', {'packages': ['corechart']});

        google.charts.setOnLoadCallback(drawChart);

        var graphdata;
        var options = {

            title: 'Sensor Results',

            curveType: 'function',

            legend: {position: 'right'},

            hAxis: {
                title: 'Reading Number'
            },
            vAxis: {
                title: 'Sensor Frequency'
            }

        };

        function drawChart() {

            graphdata = new google.visualization.DataTable();
            graphdata.addColumn('number', 'count');
            graphdata.addColumn('number', 'Sensor1');
            graphdata.addColumn('number', 'Sensor2');
            graphdata.addColumn('number', 'Sensor3');
            graphdata.addColumn('number', 'Sensor4');
            graphdata.addRow(data);
            loadnewData();
            setInterval(loadnewData, 10000);
        }

        function loadnewData() {

            if (graphdata.getValue(graphdata.getNumberOfRows() - 1, 0) != data[0]) {
                graphdata.addRow(data);
            }

            var chart = new google.visualization.LineChart(document.getElementById('curve_chart'));
            chart.draw(graphdata, options);

            var fileref = document.createElement('script')
            fileref.setAttribute("type", "text/javascript")
            fileref.setAttribute("src", "SavedFile.js")
            document.getElementsByTagName("head")[0].appendChild(fileref)
        }

    </script>

</head>

<body>
<div style="background-image: linear-gradient(darkcyan,lightblue)">
    <br>
    <h1 align="center" style="color: black;">Sensors Graph Report</h1>
    <br>
</div>
<hr>
<div align="center" id="curve_chart" style="height: 500px"></div>
</body>

</html>
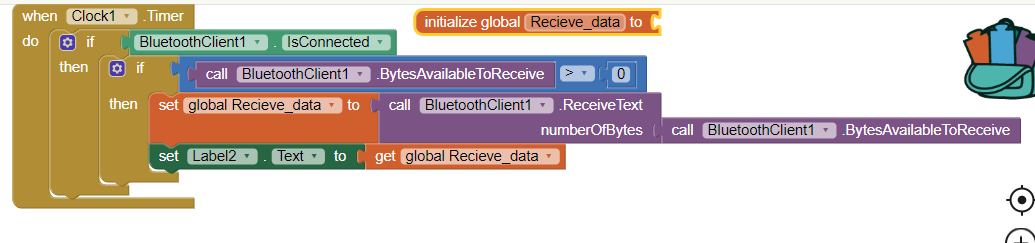
I have uploaded the aia file HTML file. What i have done is, i am getting the values from sensor as data(check in the image), and trying to plot it in the graph. i am able to plot it. but the problem is everytime the value is loaded the webviewer is getting refreshed and plotting the only value which is recieved at that time from arduino.
Kindly help me to plot all the values displaying in the app.
Thank you
kindly anyone help me in the above problem.
Thank you
Here are some corrections for you …
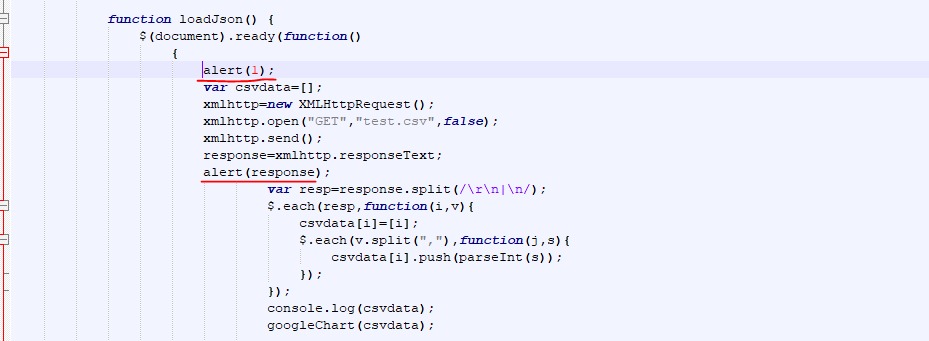
Also, your transmitted data format is neither csv nor JSON.
I have highlighted the non-csv part of the transmission code …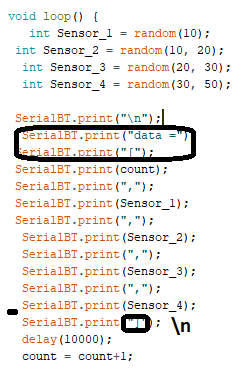
So i should not save it in js file, but the webpage created is based on the “savedfile.js” will that not affect my part of the program?
@ABG @SteveJG @TIMAI2 you are asking me send the data from arduino in csv part, but in the html file where i am getting the data part value is saved in the Js format. so if i change that to csv format it will not accept my incoming data and will not create graph. creating graph with csv part is difficult I feel. I tried by what you said. but i am not receiving the graph.
Kindly help me with this.
Another possibility would be to draw the data directly as they arrive. In this example, only one channel is drawn.
@ABG @TIMAI2 @SteveJG @Juan_Antonio yeah I saw this, but I am almost created the graph, the only struggle with that was the graph is refreshing again and again. I saw this method also, If i want to do this i have start from the beginning. Kindly please go through the part which i have done and kindly help me with that.
Thank you
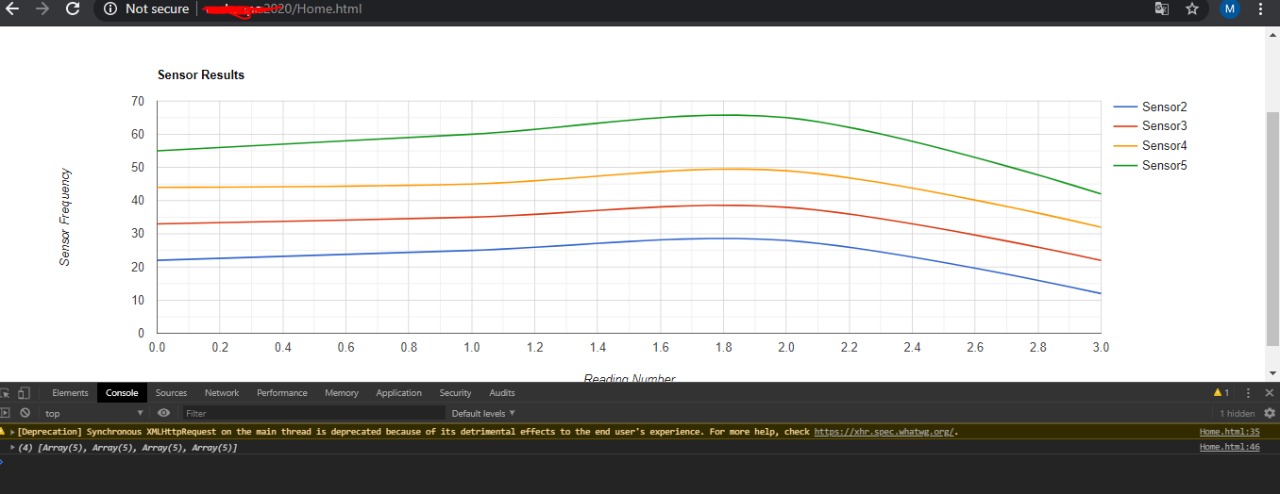
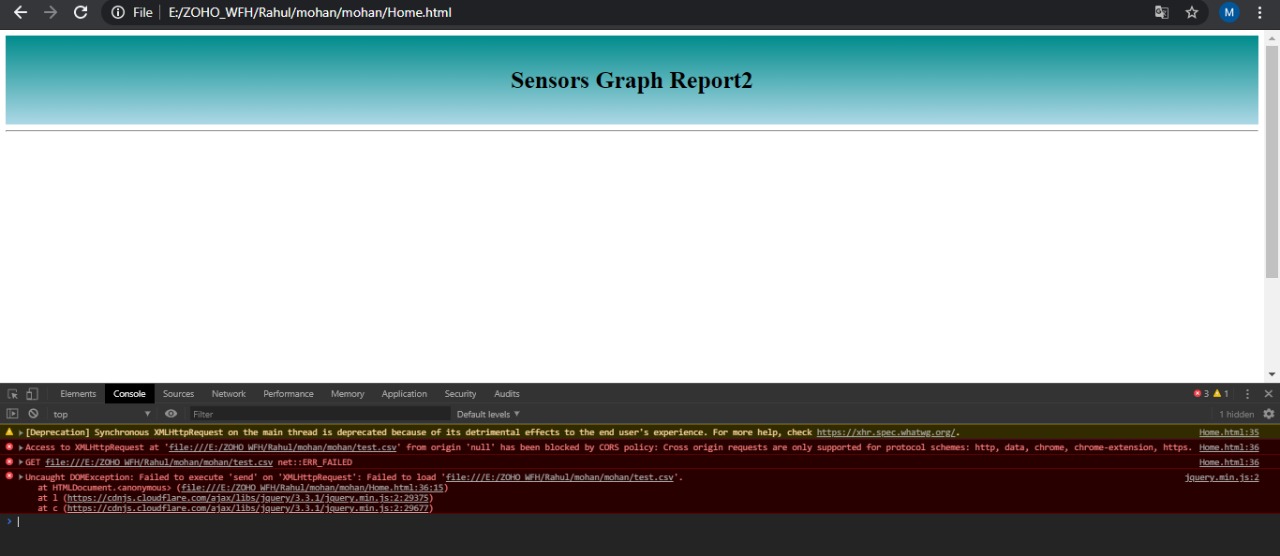
@ABG @TIMAI2 @SteveJG @Juan_Antonio I am trying to read the CSV using XMLHttpRequest(), which works fine when load the html in a server which I have tested in PC (Image 2). But the same is not loaded when the file is accessed using file protocol due to CORS policy (Image 3). I think the same CORS policy problem is occurring in the MIT AppInventor’s webviewer.(Check Image 4 only the alert(1) is popped up and alert(response) is not popping.
Please assist me to resolve the CORS policy problem in APP

Kindly help me regarding the above issue!