Here is an example, using the Chartmakerplus extension:
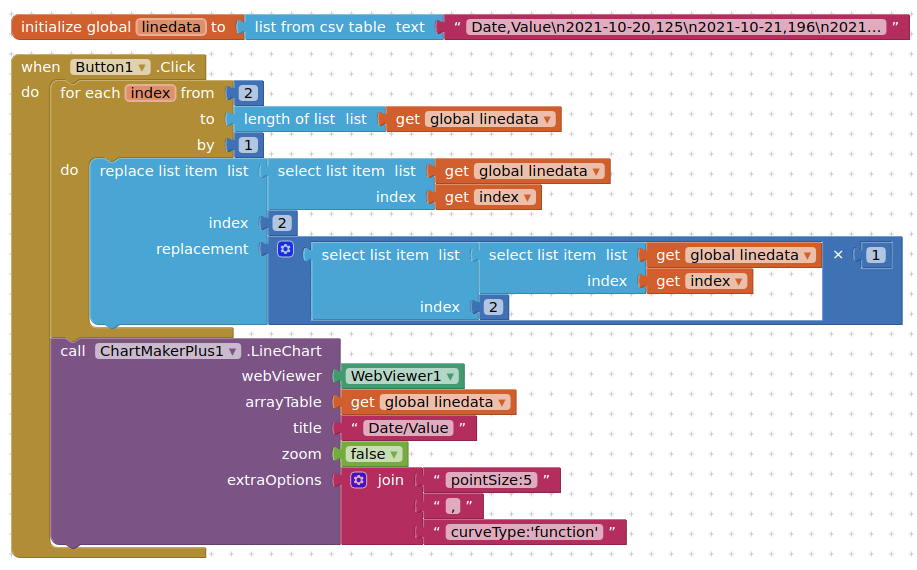
The values in global linedata represent what is likely to be returned from the google sheet, and assumes that the dates are strings and not numbers
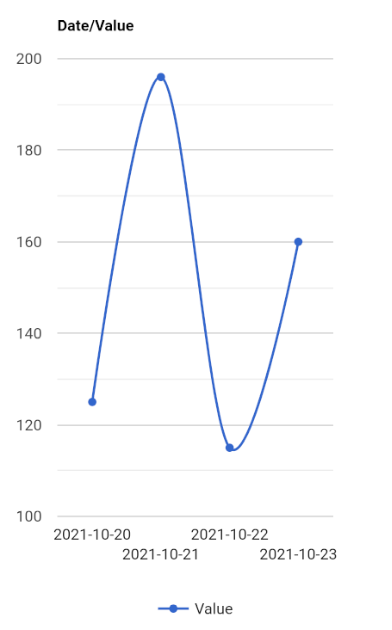
Here is an example, using the Chartmakerplus extension:
The values in global linedata represent what is likely to be returned from the google sheet, and assumes that the dates are strings and not numbers