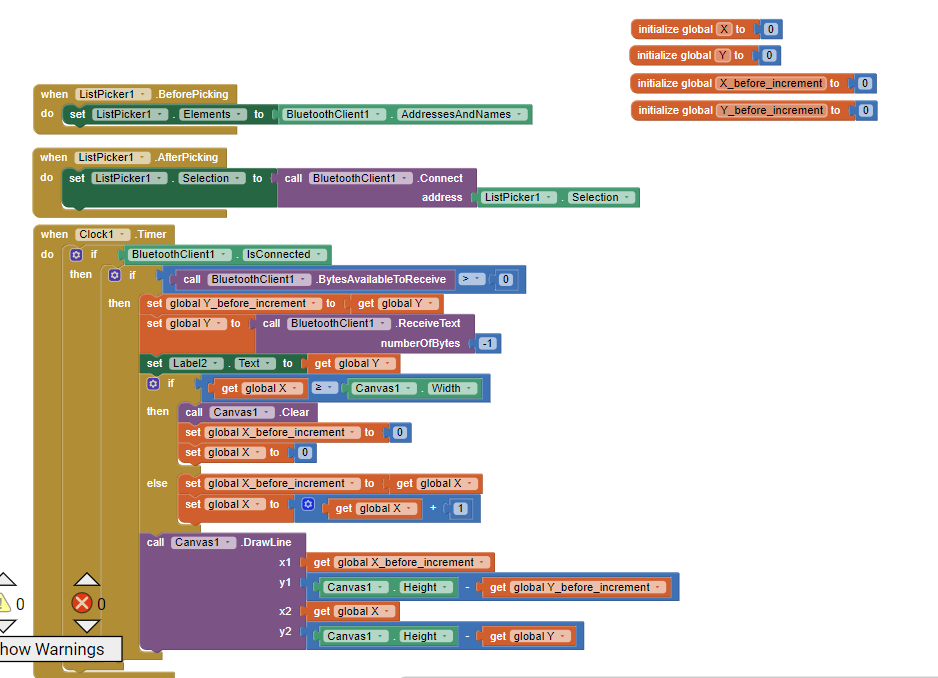
Ahh OK I'm following. I'm aware of Divide and Conquer and just couldn't figure a way of reducing this problem down. So the graph can be plotted as it is definitely receiving data via Bluetooth. But when trying to plot said data it does not. Struggling to figure out why.
I've had some time away from this project, I'll return soon but I forgot to bring the device on my trip so I'll have to wait a little longer then I had hoped.
thank you so much. I followed this revised for my set up and graph run in real time.
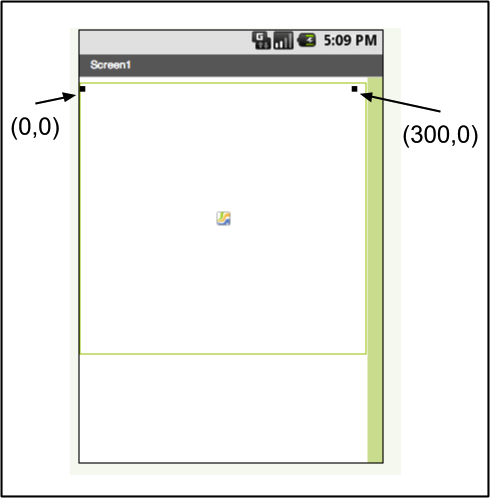
But I dont understand well why Canvas1.height - global Y because I searched canvas coordinate system in MIT and compared. I am confused that step.