Can you give me an example, please?
And, does it has to be an sd card file path?
The example is provided in the first post of this topic!
You may need to contact @Juan_Antonio if the base directory of /mnt/sdcard now needs adjusting in order to cope with Android 10+ file locations and permissions, but /mnt/scard should work fine for Android 9 and below.
So could it be file:///mnt/sdcard/drawing.png?
I get it now, thanks!
Hola Juan Antonio.
Te consulto un detalle sobre esta extension.
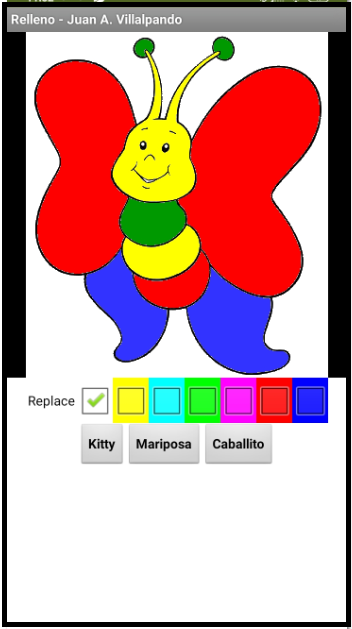
Puede rellenar poligonos o formas geometricas que tengan cualquier forma?
Yo tengo la idea de hacer una app que toma datos de un solarimetro. (ya esta funcionando, lo unico que falta implentar es esto).
Quiero poner en la app datos de radiacion UV (todo ello ya funciona). PERO... Queria ver si podia usar la grafica en forma de triangulo que existe de la tabla de seguridad de radiacion uv.
La forma es de un triangulo, que al comienzo, empieza con verde, luego con un gradiente de colores que termina en violeta.
Va desde 1 a mas de 11 en el dia. Si la medicion es 0 es por que es de noche, o tiene un defecto el sensor.
Bueno, la idea era ir generando partes del triangulo de un color a otro, que grafique las partes del triangulo, con su color correspondiente en funcion del valor obtenido.
Esto se puede hacer con tu extension?
Also see here, which might inspire you
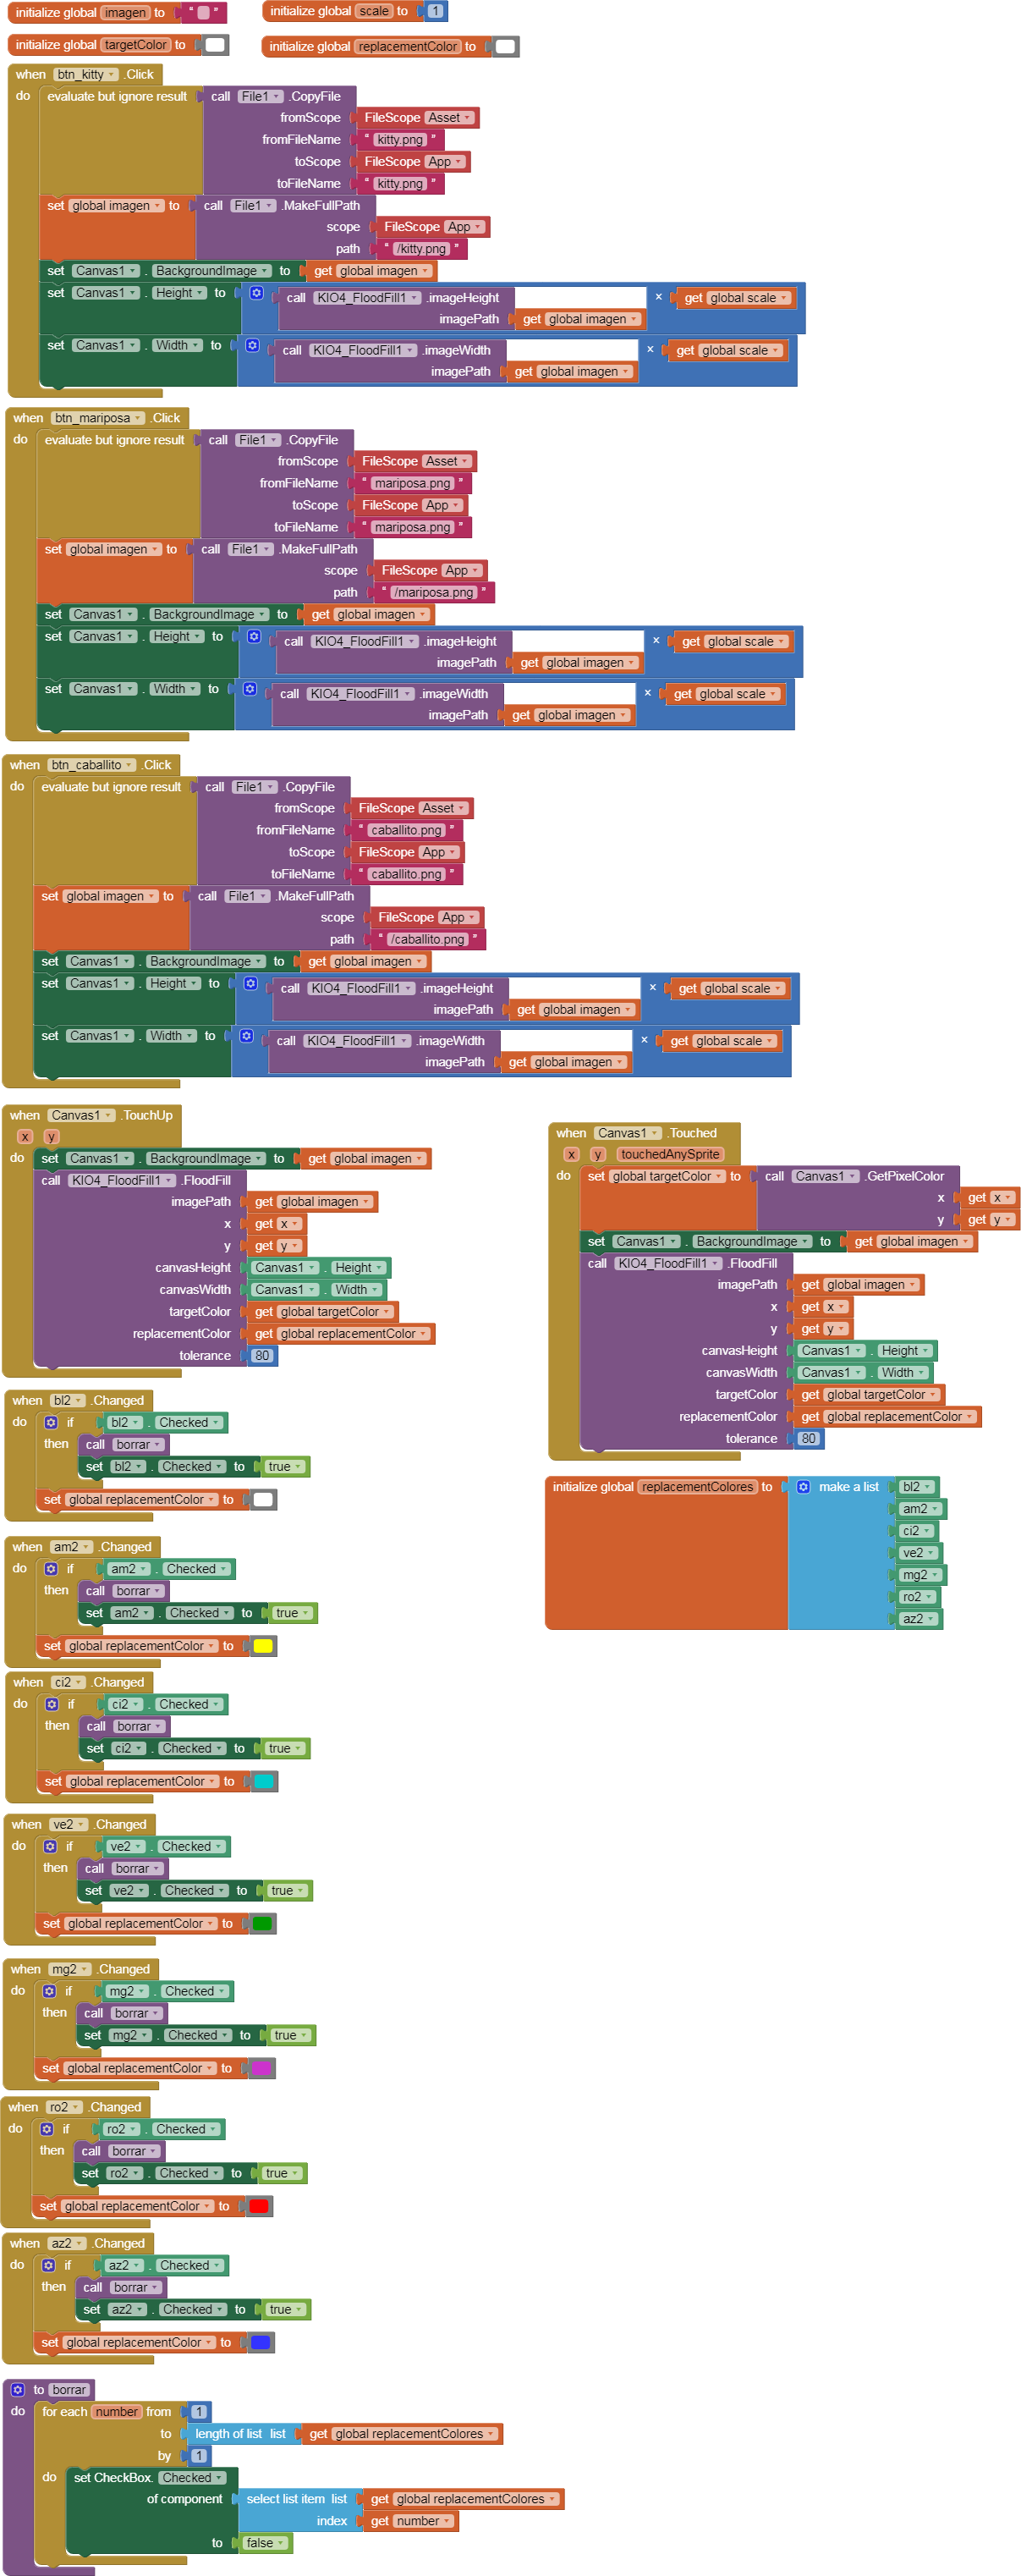
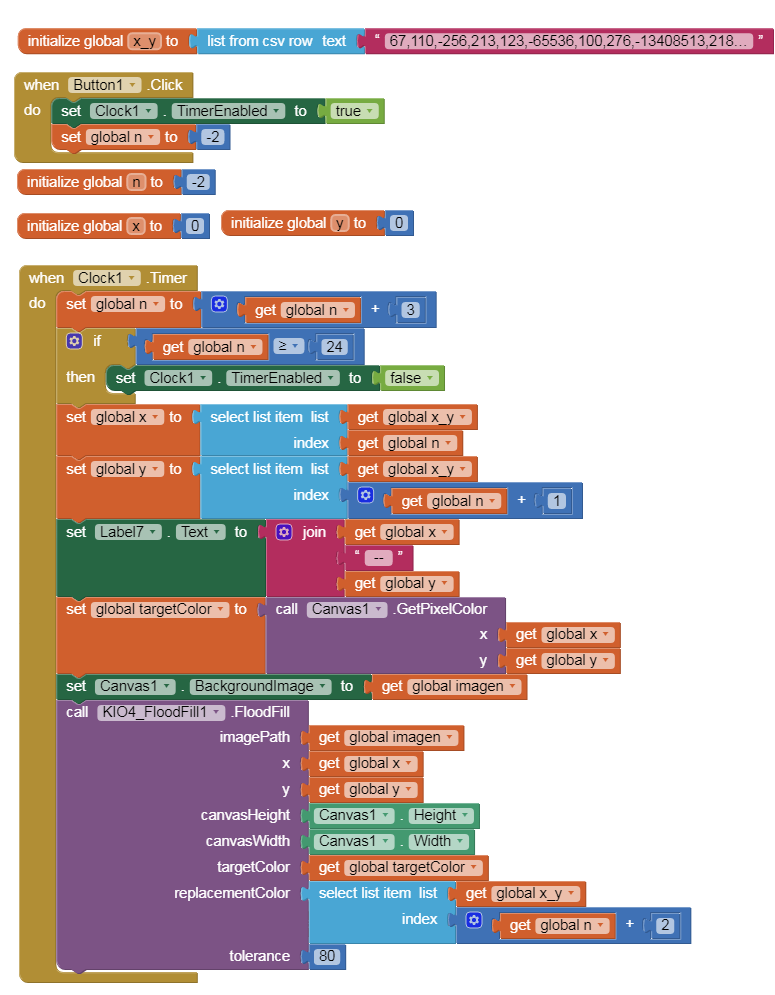
- Automatic filling by means of a Clock.
In this example we create a list with coordinates and color: x,y,color
list x_y: 67,110,-256,213,123,-65536,100,276,-13408513,218,314,-16738048,131,207,-3394612,148,241,-39424,172,275,-10027009,137,141,-13312,0,0,0
Using a timer, a trio of values (x,y,color) is taken every second.
The extension takes those x,y,color values and modifies the color of the zone.
p187C5i_extension_rellenar.aia (194.1 KB)
2 Likes
Thank you TIMAI2, i will check it.
I have a new way to show the data in the middle. That's the reason of not replay it sooner.
Thanks again.
Hi Juan.
Well I manage to make a new representation of the graphic.
With a Circular gauge. (Now is working well), but this example will improve my knowledge and i hope will be useful for another project.
Very Good Juan.