Data Science with Charts and GoogleSheets

Now you can do amazing Data Science work in MIT App Inventor with our new Charts and GoogleSheets components.

Do not forget to update your AI2 Companion for the new release!

10 Likes

Congratulations to the AI2 App Inventor team. New version, new components to strengthen our projects. Congratulations and thank you all for your dedication.

4 Likes

Amazing!!!

Hello,
In the past, when drawing charts, I used someone else's extension or called Chart.js with JavaScript. I am very happy that Chart is now included as a standard feature. Now is the season for typhoons in Japan. I can well display the barometric pressure changes associated with the approach of a typhoon using this Chart function. We plan to share barometric pressure data from people in other locations in CloudDB as well.

4 Likes

We also have a nice new DataFile component.

image

Thanks for the great update. I think we should create a Announcement topic for this and pin it in the community.

That sounds like a really great project. I hope you post about it here once it's done!

Thank you for your encouragement. Yes, I would love to move forward with this project.

1 Like

@yamafu , I believe in the power of collaborative learning and the support we receive and give to community members. Go ahead with this project and be happy.

Thank you for your encouragement.
I wrote about a very preliminary trial below:

1 Like

Congrats ! Thank you for share with us

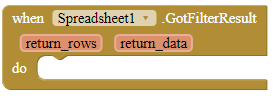
One particular block did not follow the naming conventions. Will you update it please?

image

4 Likes