I want to make app to measure air pollution in the based on your location Are there any tools to help me in app inventor??
Yes.
Use an api with the Web component to access an air quality api.
This api might be appropriate https://openweathermap.org/api/air-pollution . it has a moderate amount of free usage.
Here is a google of other air quality api's https://www.google.com/search?q=air+pollution+api&rlz=1C1CHBF_enUS887US887&oq=air+pollution+api&aqs=chrome..69i57.8257j0j7&sourceid=chrome&ie=UTF-8
This example shows one way to use an api to map UV-index How to create multiple markers from (WGS84) json data
okay I understand
But is there a way to show it on the map?
Or make it like chart is app inventor can do that??
Yes. What you can do depends on the api you use. If the api contains location information you can do it based on information from the api. If the api does not contain location information, you have to provide the coordinates of each location to post on a map.
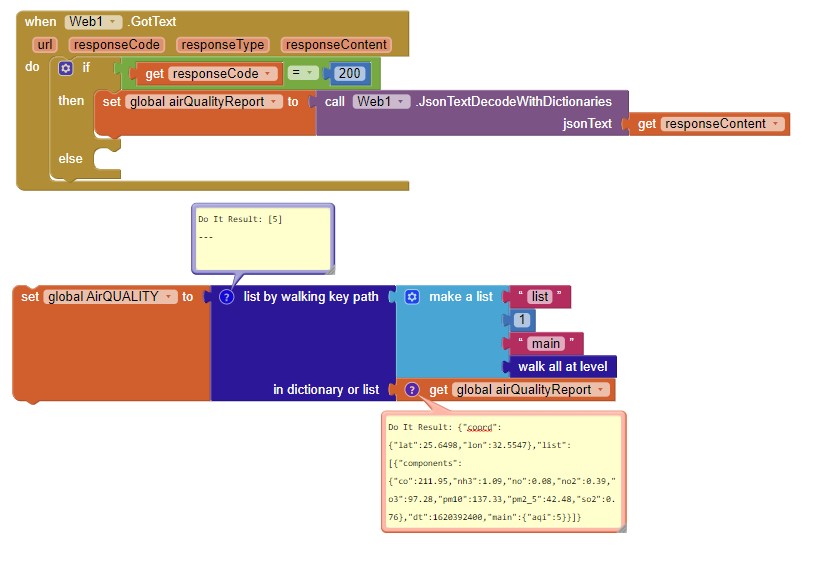
If you use the OpenWeatherMap, api, it provides coordinates. Here is what their json example will display
 . Use a Dictionary to decode the json.
The example showing one way to use an api to map UV-index places the information on a map. Did you read the example? It takes json data that contains location information and plots it on a map.
Do you mean to display the data in a table? Transform the data retrieved by the api that may be a json or xml file into a List or a csv file. Use the List or csv to provide a table possibly as shown in Taifun's Dynamic Table. If you really mean a chart, the data can be posted in a Google Chart. as shown in Tim's example showing a pie chart.
1 Like
Anyone you want. You first must decide which api you want to use.
For example, if you want to use the OpenWeatherMap, you can use their example link:
http://api.openweathermap.org/data/2.5/air_pollution?lat={lat}&lon={lon}&appid={API key} (see Air Pollution - OpenWeatherMap)
Substitute an actual latitude for {lat], an actual longitude for {lon} and provide the api key you are required to get from openweathermap for {API key}
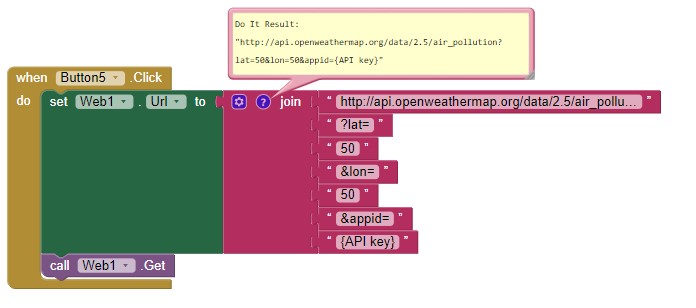
The link will not work if you do not supply an api key. You must obtain you own api key. To start using openweathermap's APIs, you can sign up here. They have a free catagory.
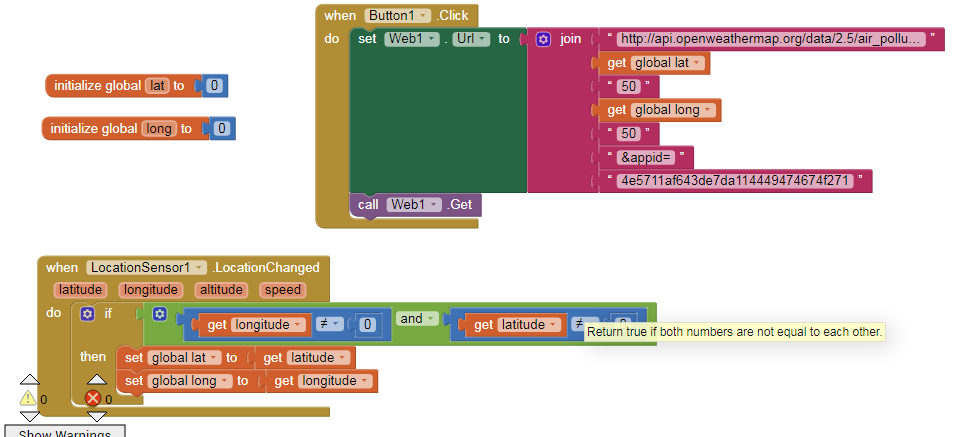

Your code is wrong. Your url must include ?lat= and ?lon= ; you can not use the dummy lat and lon from the example (50,50) and your device's location at the same time.
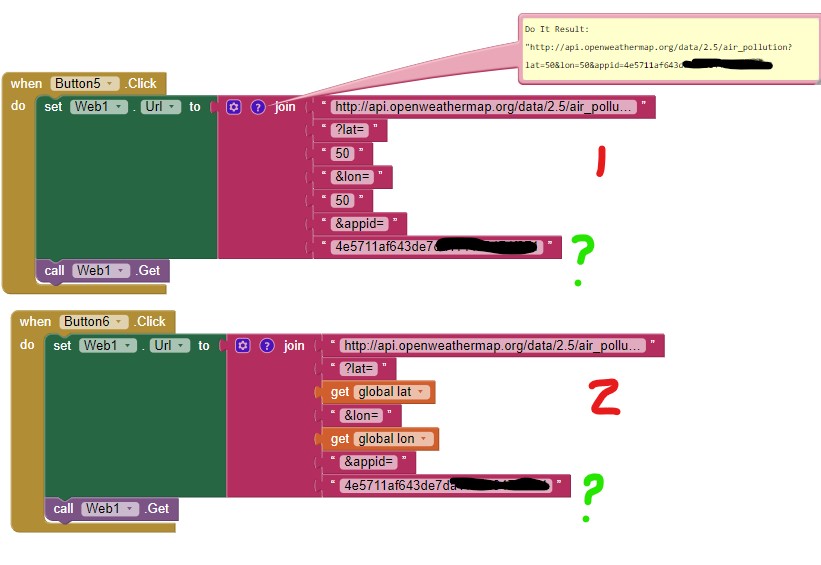
Try either example #1 or #2 ; your url must include ?lat= and ?lon=
Does #1 work? If it does not, you might check the api you entered and make sure you typed it correctly. #1 is an example from openweathermap's page and it should produce a result (responseContent) in the Web1.GetText event handler if the responseCode is 200.
If #1 works, does #2 work also? The api might not be able to provide an air quality report for your exact location.
You need to keep a list of pollutant types (no, no2, ...) and their corresponding limits. Without this little bit of research, how do we know if for example no2:0.24 is good or bad?
Expressing each reading as a list of fractions (reading/limit), you could use the maximum as a pollution measure. Alternatively, use the sum of the fractions as a pollution measure.
P.S. For extra credit, you could try displaying a little Kiviat Diagram at each reading lat/long. That's not for the faint of heart, though.
1 Like
I'm working on an app to measure the percentage of air pollution in based on location
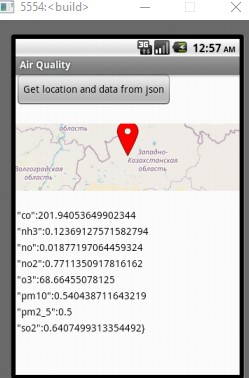
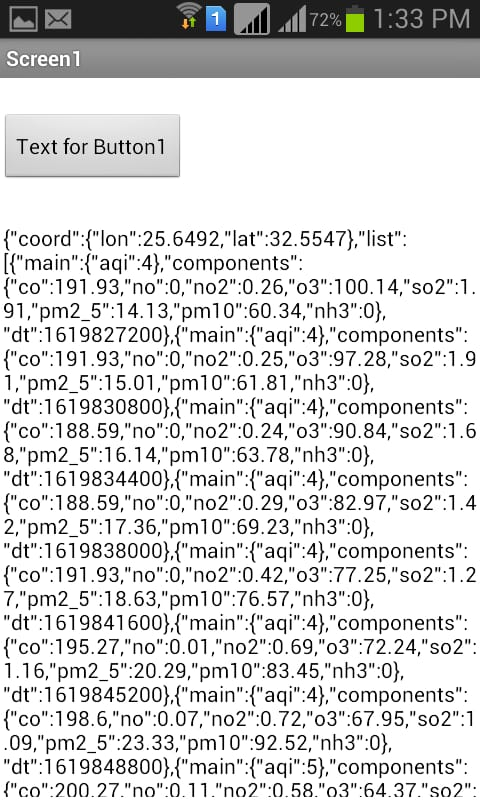
When I used Api this page appeared
The problem I have is that I want percentage of air pollution only , not all of this data, or even display the percentage of gases only, not all the data. What is the solution to this problem ??
I really want to help to fix this problem


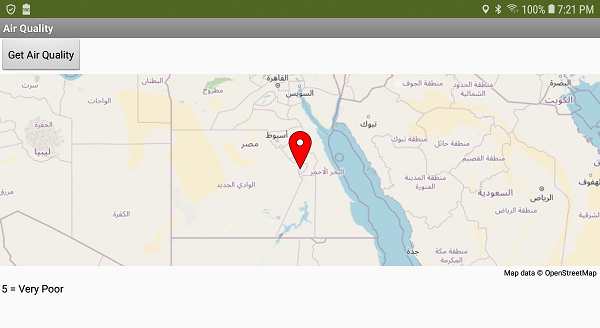
From what I have understood, 5 is what appeared in the first data due to my location , so if the location changed , the percentage will be different ??

The aqi is not a percentage, it is a static value. There are only five possibilities for the air quality index: 1 = Good, 2 = Fair, 3 = Moderate, 4 = Poor, 5 = Very Poor . The international standard for AQI is a yardstick that runs from 0 to 500, so I suspect 1 is 0 to 99; 2 is 100 to 199 etc. and the integers are an abbreviation.
Not necessarily. The value will be what the monitoring station nearest the coordinates you input reports. OpenWeatherMap only provides weather data from three location within Egypt as far as I can tell (sorry I do not know but think they only provide data for monitoring stations near Marsa Matruh, Cairo and Luxor (see their weather map Interactive weather maps - OpenWeatherMap). I suspect the aqi measurements are from these locations (but I do not know) that are nearest the coordinates you supply or it might be an estimate based on how close your coordinates are to one of the locations where they have monitoring equipment.
If you want a value of the small particulate matter in the air (dust for example) look for the component pm10. Monitor whatever you want, use a Dictionary or List to parse the json that downloads. The component values are not percentages; they are concentrations in micrograms (one-millionth of a gram) per cubic meter air or µg / m3
The api can only provide air quality for a locations that have an air quality monitoring station.
These are what openweather says is measured and reported when using the api:
Fields in API response
** coord Coordinates from the specified location (latitude, longitude)*
** list*
-
dtDate and time, Unix, UTC*
-
main*
-
main.aqiAir Quality Index. Possible values: 1, 2, 3, 4, 5. Where 1 = Good, 2 = Fair, 3 = Moderate, 4 = Poor, 5 = Very Poor.*
-
components*
-
components.coСoncentration of CO (Carbon monoxide), μg/m3*
-
components.noСoncentration of NO (Nitrogen monoxide), μg/m3*
-
components.no2Сoncentration of NO2 (Nitrogen dioxide), μg/m3*
-
components.o3Сoncentration of O3 (Ozone), μg/m3*
-
components.so2Сoncentration of SO2 (Sulphur dioxide), μg/m3*
-
components.pm2_5Сoncentration of PM2.5 (Fine particles matter), μg/m3*
-
components.pm10Сoncentration of PM10 (Coarse particulate matter), μg/m3*
-
components.nh3Сoncentration of NH3 (Ammonia), μg/m3*
I hope this is useful. For more information about this api , see the first link from post #2 to read about what openweather provides.
1 Like
thanks a lot 

This topic was automatically closed 7 days after the last reply. New replies are no longer allowed.