Yes. What you can do depends on the api you use. If the api contains location information you can do it based on information from the api. If the api does not contain location information, you have to provide the coordinates of each location to post on a map.
If you use the OpenWeatherMap, api, it provides coordinates. Here is what their json example will display
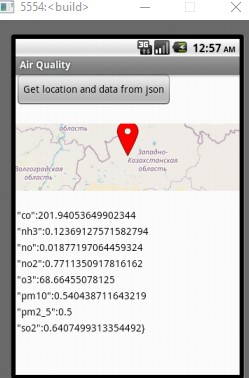
The example showing one way to use an api to map UV-index places the information on a map. Did you read the example? It takes json data that contains location information and plots it on a map.
Do you mean to display the data in a table? Transform the data retrieved by the api that may be a json or xml file into a List or a csv file. Use the List or csv to provide a table possibly as shown in Taifun's Dynamic Table. If you really mean a chart, the data can be posted in a Google Chart. as shown in Tim's example showing a pie chart.